Client Area
Home screen
Docker Grafana module WHMCS
Order now | Download | FAQ | n8n
Client Area Overview – Logical Structure
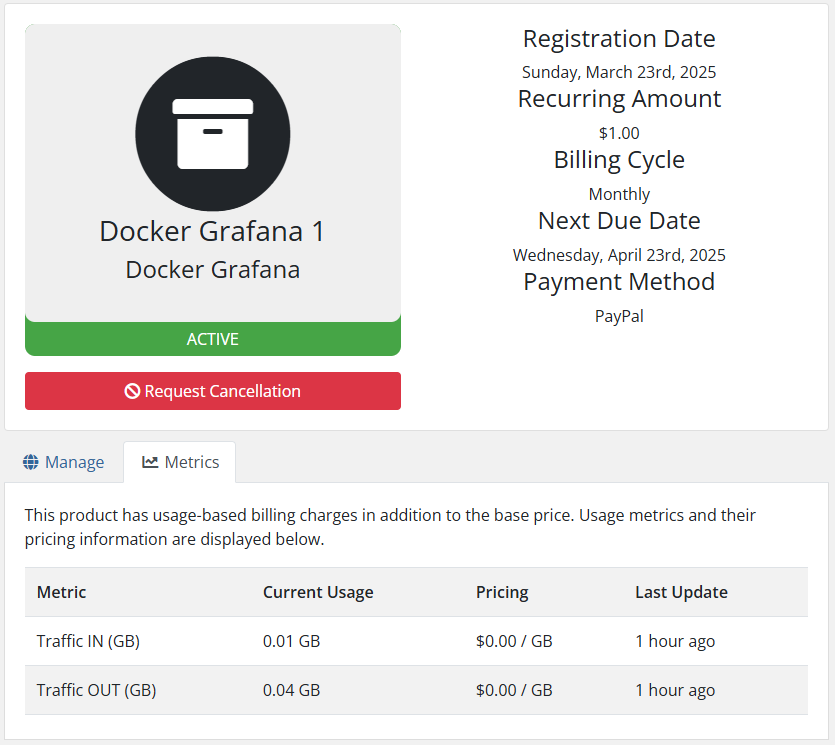
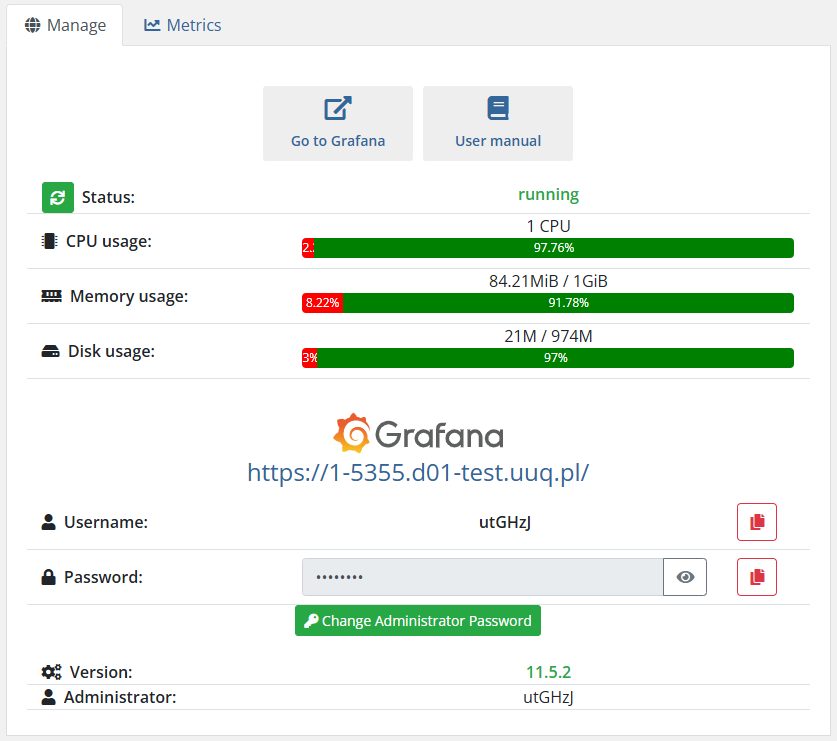
The main screen of the client area is divided into three logical sections:
This clear structure ensures that users have quick access to their application, real-time monitoring of resource usage, and essential management functions in one place.
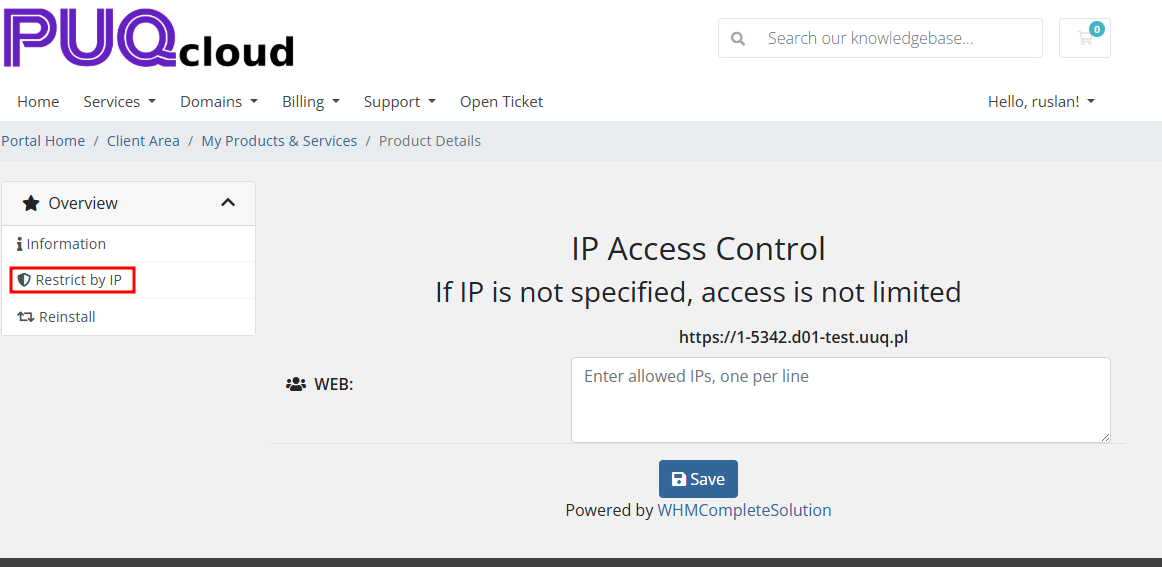
IP Access Control
Docker Grafana module WHMCS
Order now | Download | FAQ | n8n
In the client area, the client can configure access to their resource by entering allowed IP addresses in the appropriate section on the Restrict by IP page.
If no IP addresses are specified, access is open to all IP addresses.
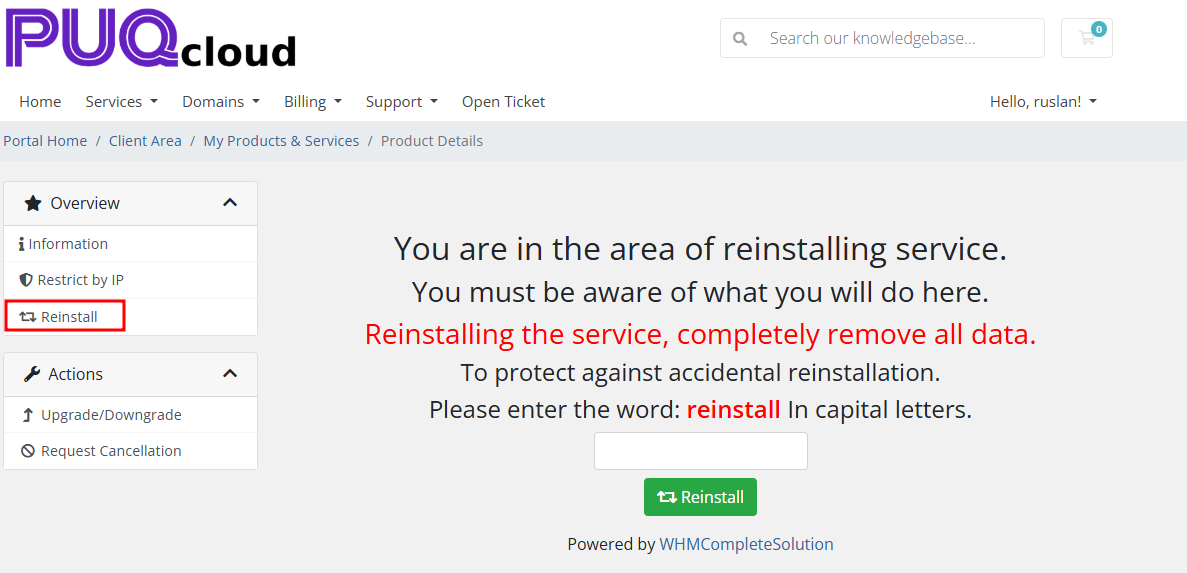
Reinstall
Docker Grafana module WHMCS
Order now | Download | FAQ | n8n
The client has the option to fully reinstall the application, which will result in complete data loss.
This action can be performed on the Reinstall page, which also includes protection against accidental reinstallation.
Metrics
Docker Grafana module WHMCS
Order now | Download | FAQ | n8n
If you use metrics for application traffic billing, the Metrics tab will display the usage statistics for the metrics.