Docker Grafana WHMCS module
A module for WHMCS that uses n8n workflows to deploy the Grafana service using Docker.
- Description
- What is Grafana
- Changelog
- Installation and configuration guide
- Basic concepts and requirements
- WHMCS setup (install/update)
- Preparing Docker Server
- Setting up n8n workflow
- Add server
- Product Configuration
- Metric Billing
- Email Template (puqDockerGrafana Welcome Email)
- Email Template (puqDockerGrafana Update Email)
- Email Template (puqDockerGrafana Notification disk limit)
- Admin Area
- Client Area
Description
Docker Grafana module WHMCS
Order now | Download | FAQ | n8n
Before you start, it is important to read and familiarize yourself with the following articles at this link:
https://doc.puq.info/books/docker-modules
The WHMCS Docker Grafana module is designed for automated provisioning and management of Grafana instances on a Docker server. It seamlessly integrates with WHMCS, allowing businesses to sell and manage Grafana services efficiently.
Key Features
🚀 Automated Container Management
- Automatic creation of an Grafana container upon service order.
- Automated package upgrades and administrator password reset.
🔒 Service Control & Security
- Service creation
- Service suspension and reactivation.
- Service termination
- Full reinstallation
- IP access control
🛠️ Advanced Diagnostic Tools
- Built-in tools for diagnosing and managing containers.
🌍 Multilingual Support
- Supports multiple languages, including Arabic, Azerbaijani, Catalan, Chinese, Croatian, Czech, Danish, Dutch, English, Estonian, Farsi, French, German, Hebrew, Hungarian, Italian, Macedonian, Norwegian, Polish, Romanian, Russian, Spanish, Swedish, Turkish, and Ukrainian.
⚙️ Fully Customizable Workflows
- Uses n8n workflows to automate processes, allowing full customization for business-specific needs.
System Requirements
To run the WHMCS Docker Grafana module, ensure you have:
✅ WHMCS version 8+
✅ An n8n server for workflow automation
✅ A server with Docker installed for container management (Installation Guide)
Installation & Setup
1️⃣ Environment Preparation
- Install WHMCS 8+.
- Set up an n8n server for automation workflows.
- Ensure Docker is installed and running. (Installation Guide)
2️⃣ Module Installation
- Upload and activate the WHMCS Docker Grafana module.
- Configure the module settings to connect with your Docker server and n8n workflows.
3️⃣ Workflow Customization
- Utilize n8n workflows to automate service provisioning and management.
- Modify workflows as needed for custom business logic.
4️⃣ Testing & Deployment
- Perform a test order to verify automatic container creation.
- Check all service management functions (creation, suspension, unsuspension, termination).
Why Choose This Module?
✅ Seamless automation – Reduces manual work and speeds up service deployment.
✅ Highly customizable – Modify workflows to fit any business model.
✅ User-friendly – Integrated within WHMCS with a simple setup process.
This module makes selling and managing Grafana instances through WHMCS easy, automated, and flexible! 🚀
What is Grafana
Docker Grafana module WHMCS
Order now | Download | FAQ | n8n
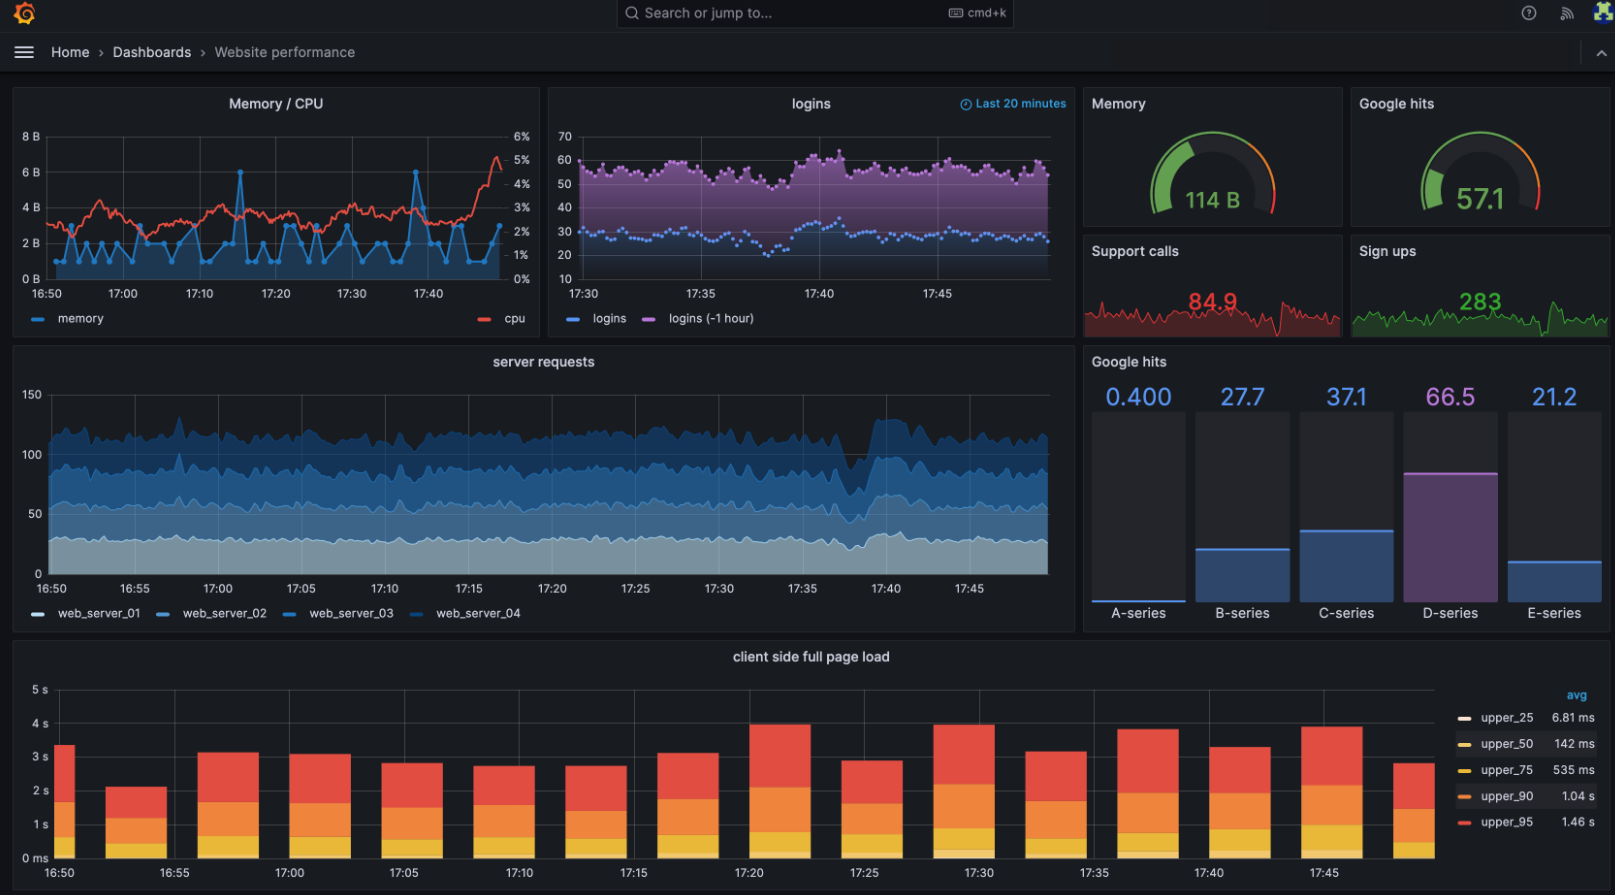
Grafana is an open-source platform for monitoring, visualization, and analysis of time-series data. It allows users to create dashboards and graphs to gain insights from various data sources in real-time. Originally developed by Torkel Ödegaard in 2014, Grafana has grown into one of the most popular tools for observability and analytics, used by developers, IT operations teams, and businesses worldwide.
Key Features of Grafana
- Custom Dashboards – Users can build interactive dashboards with panels that display data from multiple sources.
- Wide Range of Data Sources – Supports Prometheus, InfluxDB, Elasticsearch, MySQL, PostgreSQL, Loki, and many more.
- Alerting System – Configurable alerts with notifications via Slack, PagerDuty, email, and other channels.
- User Management & Authentication – Role-based access control (RBAC) and integration with OAuth, LDAP, and other authentication systems.
- Plugins & Extensibility – Numerous plugins available for additional visualizations and data sources.
- Annotations – Add context to graphs with notes about specific events.
- Multi-Tenancy – Supports multiple organizations with isolated dashboards and data sources.
- Enterprise Support – A commercial version provides enhanced security, scalability, and team collaboration features.
Where is Grafana Used?
Grafana is widely used in various industries and IT environments, including:
1. IT Infrastructure Monitoring
- Used for tracking system performance, CPU usage, memory consumption, network statistics, and application uptime.
- Works with Prometheus, Zabbix, and Nagios to visualize real-time metrics.
2. Cloud & DevOps Monitoring
- Monitors Kubernetes clusters, Docker containers, and cloud-based services like AWS, Azure, and Google Cloud.
- Helps DevOps teams with CI/CD pipelines by integrating with Jenkins, GitLab CI/CD, and other tools.
3. Application Performance Monitoring (APM)
- Monitors application logs, traces, and request latencies by integrating with Loki, Jaeger, and OpenTelemetry.
- Helps developers diagnose performance bottlenecks and optimize application behavior.
4. Business Analytics & Finance
- Used in financial institutions for tracking market trends, sales performance, and operational analytics.
- Can visualize data from SQL databases like MySQL and PostgreSQL for business intelligence purposes.
5. IoT and Industrial Monitoring
- Monitors sensor data from IoT devices in real-time.
- Used in industries like manufacturing, energy, and smart cities to track environmental conditions and equipment status.
What Data Sources Can Grafana Work With?
Grafana supports a wide variety of data sources, making it a highly flexible visualization tool:
- Time-Series Databases: Prometheus, InfluxDB, Graphite
- SQL Databases: MySQL, PostgreSQL, Microsoft SQL Server
- Logging and Tracing Tools: Elasticsearch, Loki, Jaeger, OpenTelemetry
- Cloud Services: AWS CloudWatch, Google Cloud Monitoring, Azure Monitor
- Monitoring Tools: Zabbix, Nagios, New Relic, Datadog
- IoT and Industrial Data: OPC-UA, MQTT, ThingsBoard
How Grafana Works
Grafana operates as a web-based application, typically deployed as a service accessible via a browser. The workflow involves:
- Connecting Data Sources: Configure one or more data sources like Prometheus, InfluxDB, or MySQL.
- Building Dashboards: Create panels displaying metrics in graphs, tables, or heatmaps.
- Setting Alerts: Define thresholds and notification channels for real-time alerts.
- User Access Management: Configure authentication and permissions for different users and teams.
- Extending with Plugins: Add visualization types, new data sources, or integrations with external systems.
Conclusion
Grafana is a powerful and versatile tool for visualizing and monitoring data across various domains. Its ability to integrate with numerous data sources and provide interactive dashboards makes it an essential tool for IT professionals, developers, and businesses. Whether you need to monitor cloud infrastructure, track application performance, analyze business data, or oversee industrial processes, Grafana provides an intuitive and highly customizable solution.
Changelog
Docker Grafana module WHMCS
Order now | Download | FAQ | n8n
v1.0 Released 24-03-2025
First version
Installation and configuration guide
Basic concepts and requirements
Docker Grafana module WHMCS
Order now | Download | FAQ | n8n
Before you start, it is important to read and familiarize yourself with the following articles at this link:
https://doc.puq.info/books/docker-modules
The WHMCS Docker Grafana module is part of the WHMCS Docker module series developed by PUQcloud. This module enables service providers to offer Grafana Docker containers as a service to their clients, allowing for seamless automation and integration.
The system consists of three core components:
🖥️ WHMCS Module
The core component, installed in WHMCS, manages service provisioning and automation from the WHMCS side.
📡 Debian 12 Server
A server running Debian 12 with the following pre-installed:
✅ Docker – For container management
We have prepared instructions for installing and configuring Docker
https://doc.puq.info/books/docker-modules/page/installing-docker-for-puqcloud-modules
🔗 n8n Server
This server facilitates communication between the WHMCS module and the Docker server, ensuring smooth workflow execution.
To explore n8n’s full potential, visit the official n8n website for documentation, tutorials, and community support.
Key Features & Concepts
⚙️ Workflow Automation
n8n provides a graphical workflow builder, allowing users to automate various tasks, such as:
✔️ Sending notifications
✔️ Configuring firewalls on external routers
✔️ Managing DNS settings
✔️ Custom automation processes tailored to specific needs
🔄 Flexibility & Customization
The module offers personalized settings and supports elastic automation, giving clients full control over their n8n workflows.
WHMCS setup (install/update)
Docker Grafana module WHMCS
Order now | Download | FAQ | n8n
Module is coded ionCube v13
Supported php version:
- php 7.4 WHMCS 8.11.0 -
- php 8.1 WHMCS 8.11.0 +
- php 8.2 WHMCS 8.11.0 +
To install and update a module, you must perform one and the same action.
1. Download the latest version of the module.
PHP 8.2
wget http://download.puqcloud.com/WHMCS/servers/PUQ_WHMCS-Docker-Grafana/php82/PUQ_WHMCS-Docker-Grafana-latest.zipPHP 8.1
wget http://download.puqcloud.com/WHMCS/servers/PUQ_WHMCS-Docker-Grafana/php81/PUQ_WHMCS-Docker-Grafana-latest.zipPHP 7.4
wget http://download.puqcloud.com/WHMCS/servers/PUQ_WHMCS-Docker-Grafana/php74/PUQ_WHMCS-Docker-Grafana-latest.zipAll versions are available via link: https://download.puqcloud.com/WHMCS/servers/PUQ_WHMCS-Docker-Grafana/
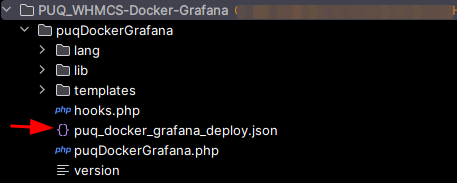
2. Unzip the archive with the module.
unzip PUQ_WHMCS-Docker-Grafana-latest.zip3. Copy and Replace "puqDockerGrafana" from "PUQ_WHMCS-Docker-Grafana" to "WHMCS_WEB_DIR/modules/servers/"
Preparing Docker Server
Docker Grafana module WHMCS
Order now | Download | FAQ | n8n
To install the Docker server for this module, please follow the instructions at the following link:
https://doc.puq.info/books/docker-modules/page/installing-docker-for-puqcloud-modules
Setting up n8n workflow
Docker Grafana module WHMCS
Order now | Download | FAQ | n8n
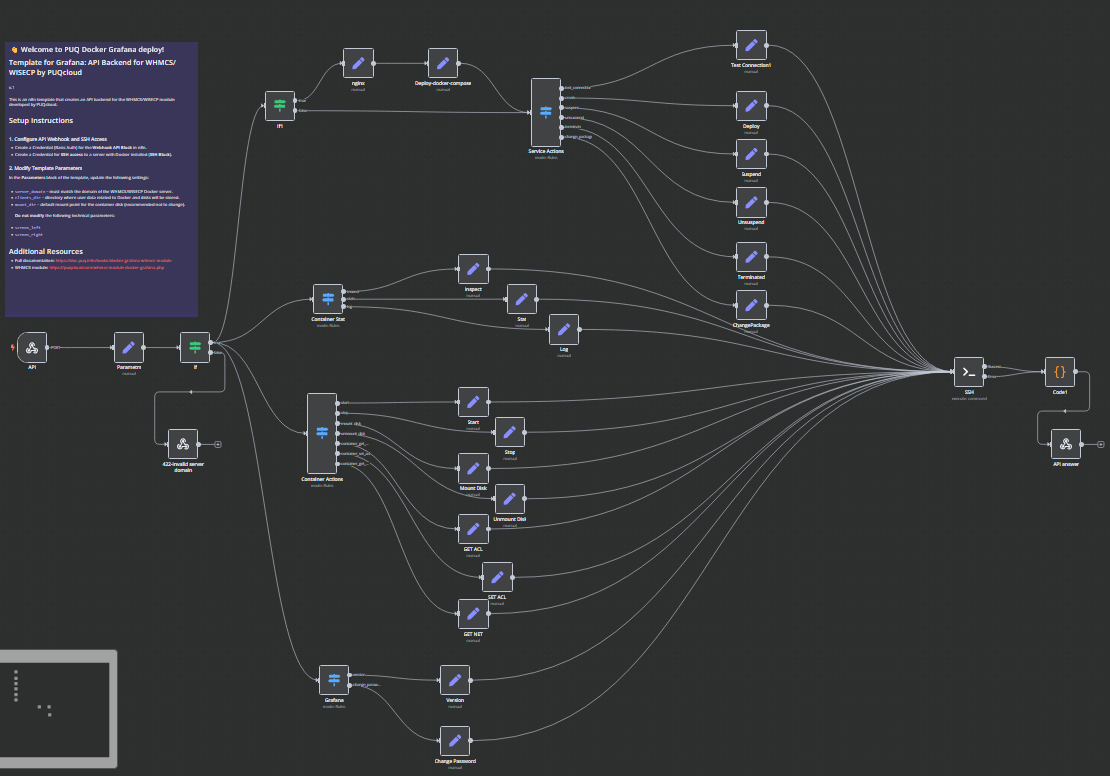
Overview
The Docker Grafana WHMCS module uses a specially designed workflow for n8n to automate deployment processes. The workflow provides an API interface for the module, receives specific commands, and connects via SSH to a server with Docker installed to perform predefined actions.
Prerequisites
- You must have your own n8n server.
- Alternatively, you can use the official n8n cloud installations available at: n8n Official Site
Installation Steps
Install the Required Workflow on n8n
You have two options:
Option 1: Use the Latest Version from the n8n Marketplace
- The latest workflow templates for our modules are available on the official n8n marketplace.
- Visit our profile to access all available templates: PUQcloud on n8n
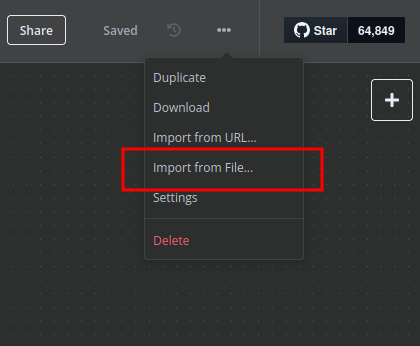
Option 2: Manual Installation
- Each module version comes with a workflow template file.

- You need to manually import this template into your n8n server.

n8n Workflow API Backend Setup for WHMCS/WISECP
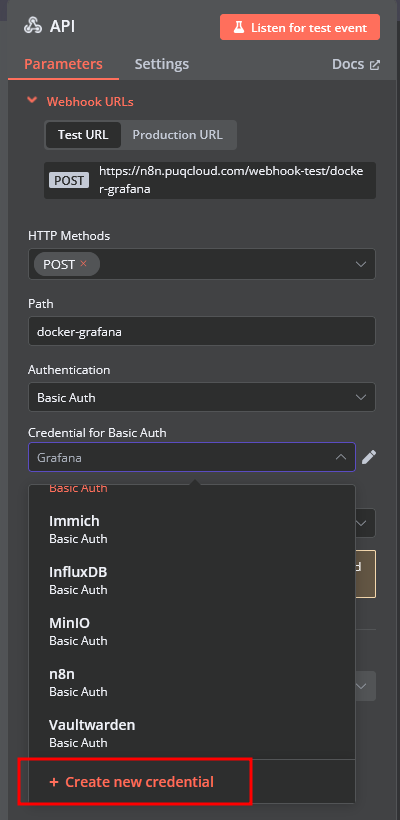
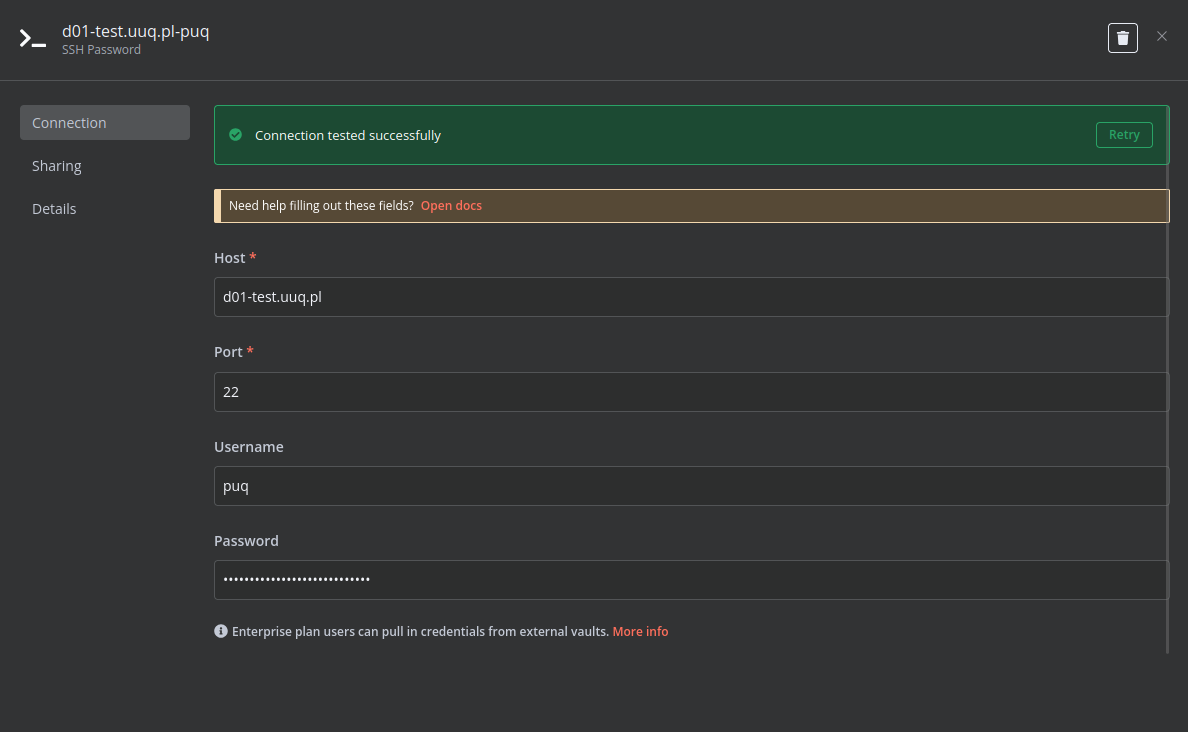
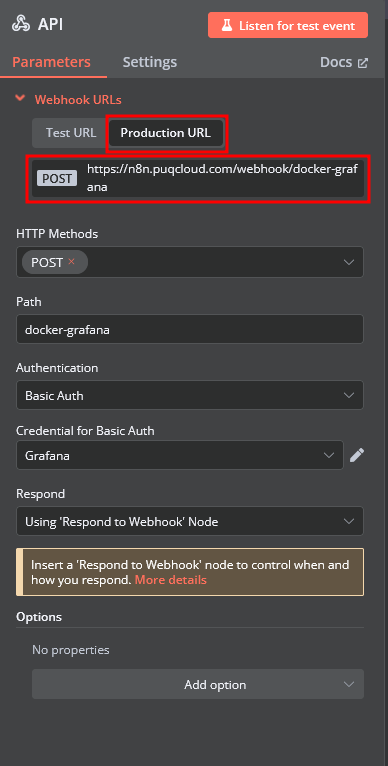
Configure API Webhook and SSH Access
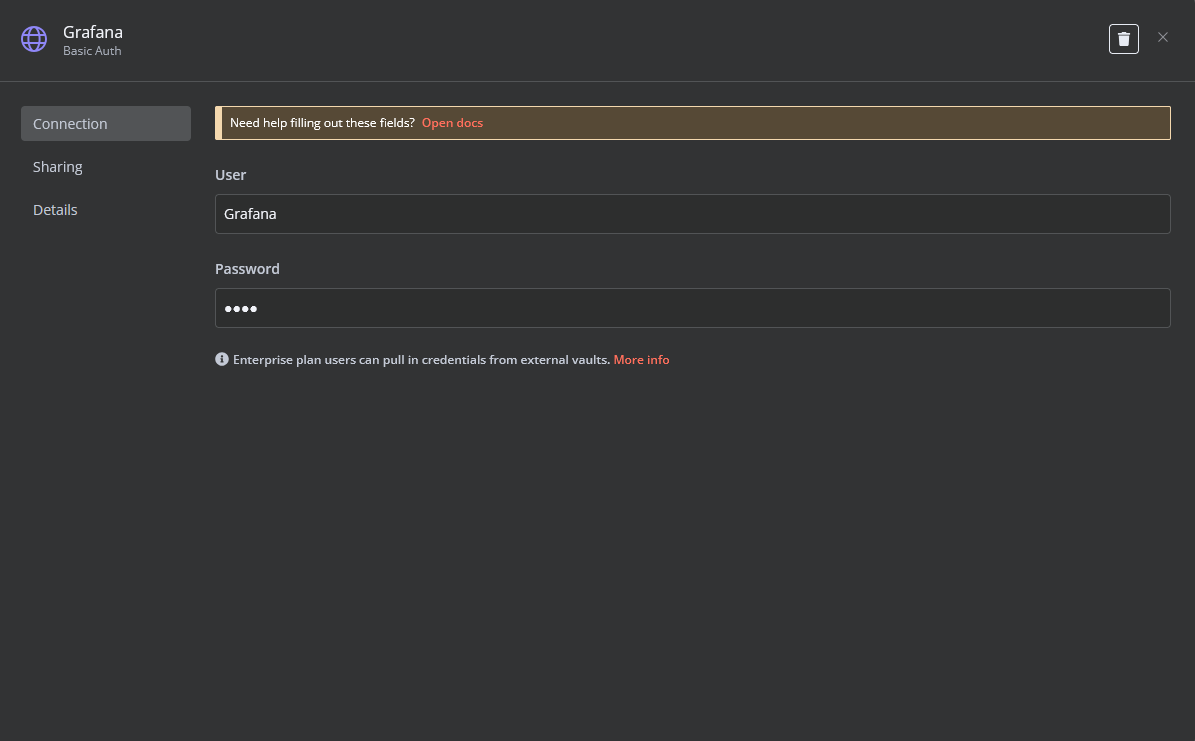
- Create a Basic Auth Credential for the Webhook API Block in n8n.


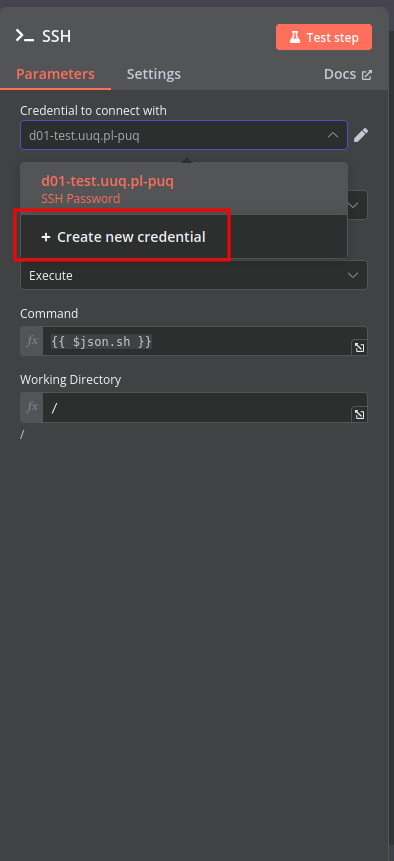
- Create an SSH Credential for accessing a server with Docker installed.


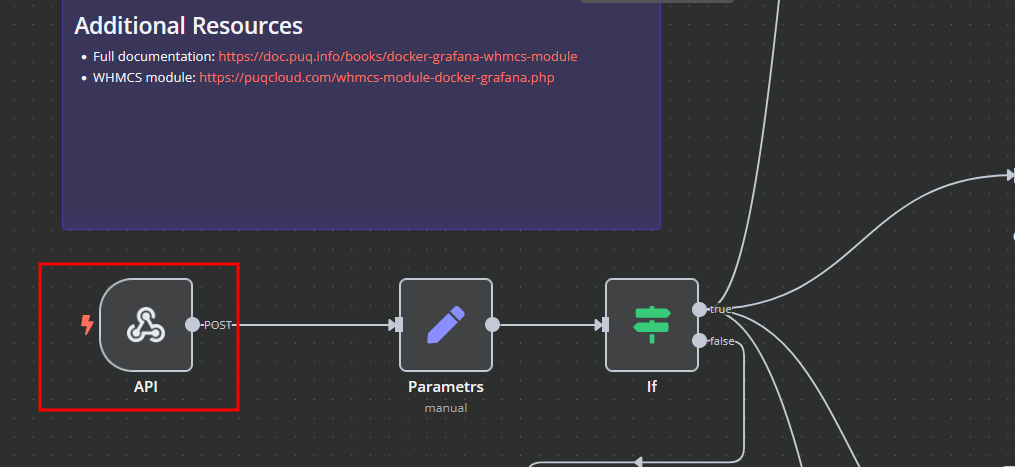
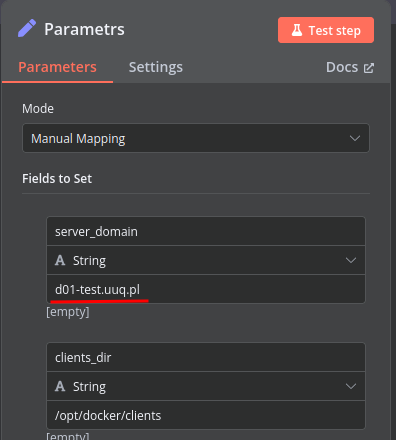
Modify Template Parameters
In the Parameters block of the template, update the following settings:
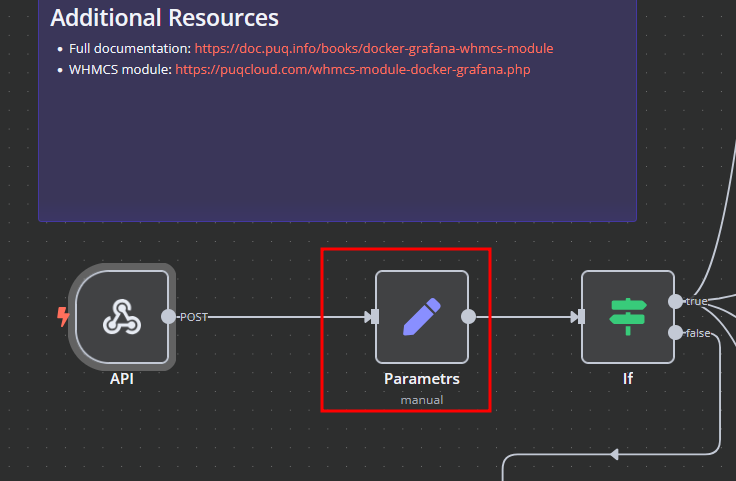
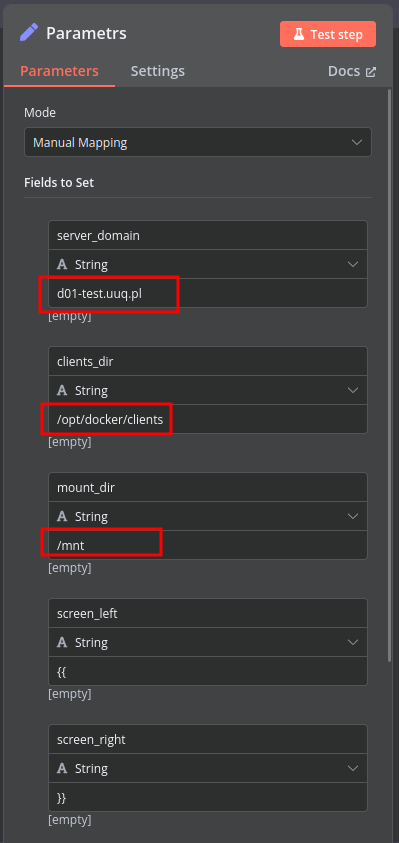
server_domain– Must match the domain of the WHMCS/WISECP Docker server.clients_dir– Directory where user data related to Docker and disks will be stored.mount_dir– Default mount point for the container disk (recommended not to change).
Do not modify the following technical parameters:
screen_leftscreen_right
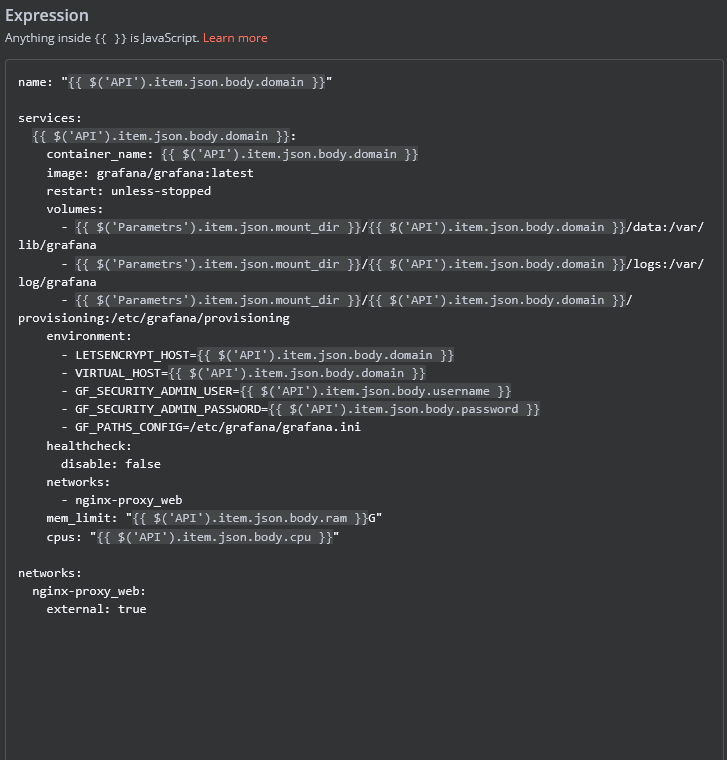
Deploy-docker-compose
In the Deploy-docker-compose element, you have the ability to modify the Docker Compose configuration, which will be generated in the following scenarios:
- When the service is created
- When the service is unlocked
- When the service is updated
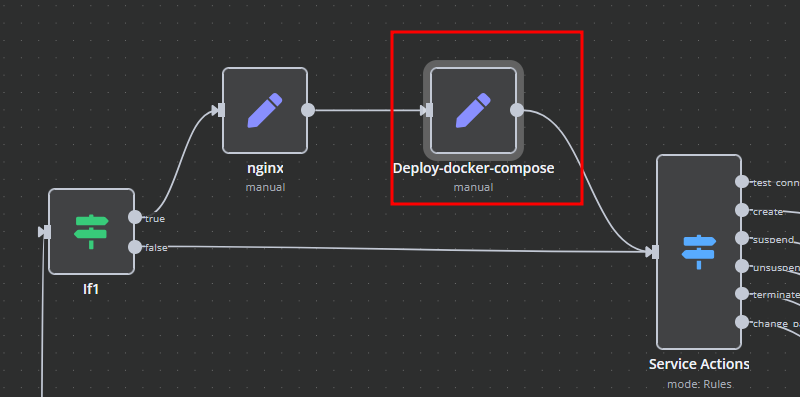
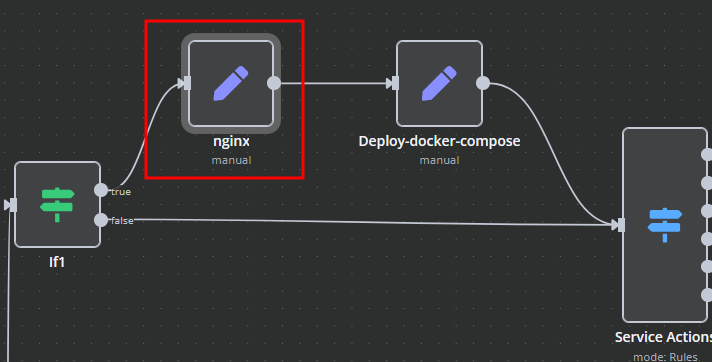
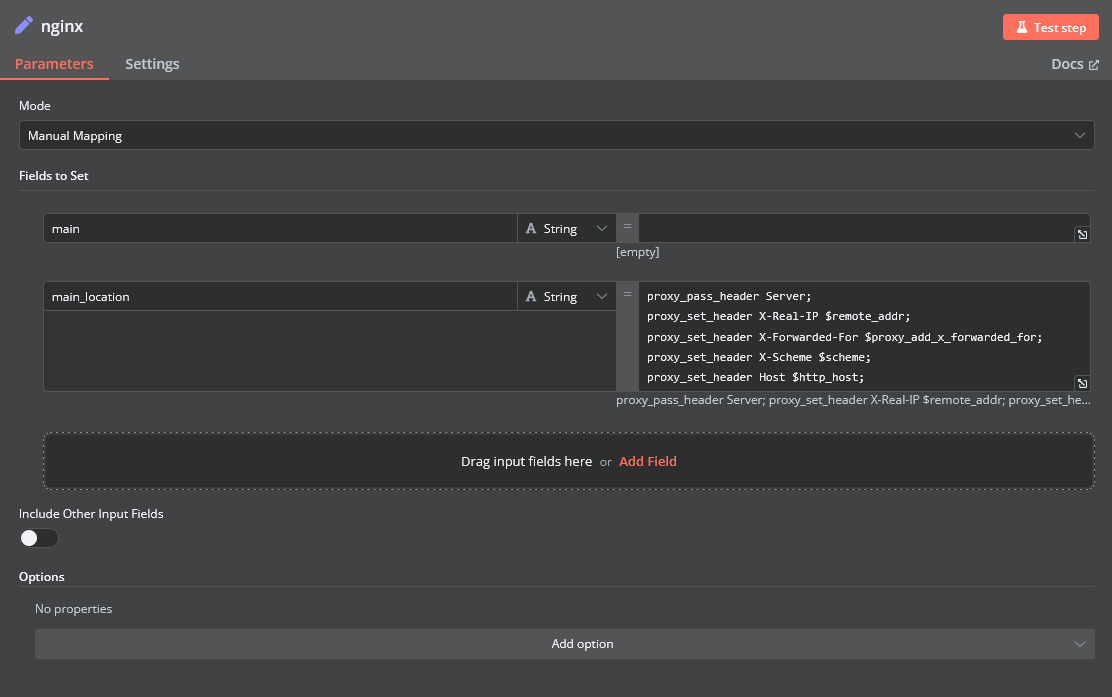
nginx
In the nginx element, you can modify the configuration parameters of the web interface proxy server.
- The main section allows you to add custom parameters to the server block in the proxy server configuration file.
- The main_location section contains settings that will be added to the location / block of the proxy server configuration. Here, you can define custom headers and other parameters specific to the root location.
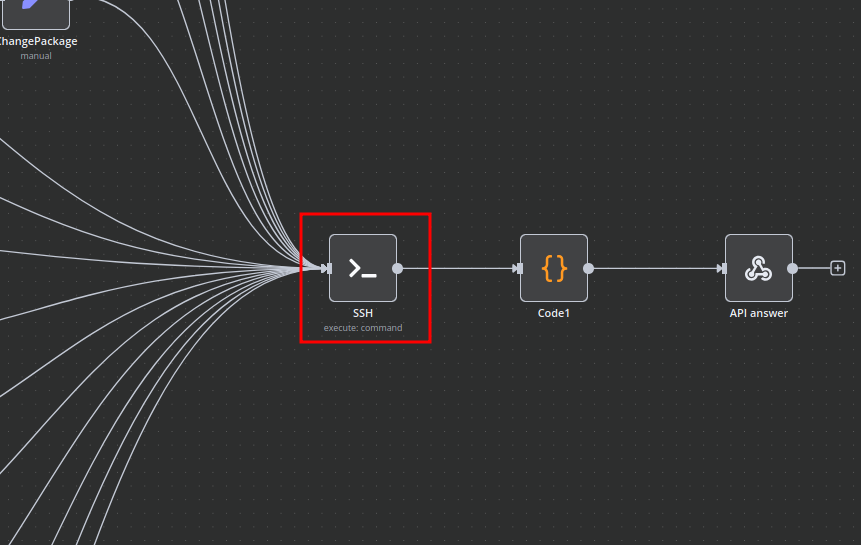
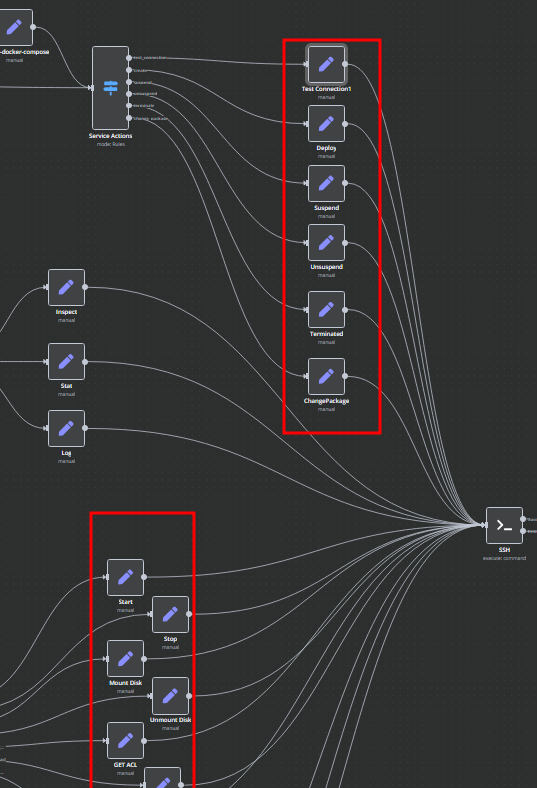
Bash Scripts
Management of Docker containers and all related procedures on the server is carried out by executing Bash scripts generated in n8n. These scripts return either a JSON response or a string.
- All scripts are located in elements directly connected to the SSH element.
- You have full control over any script and can modify or execute it as needed.
Add server
Docker Grafana module WHMCS
Order now | Download | FAQ | n8n
Add a new server to the system WHMCS.
System Settings->Servers->Add New Server- Enter the correct Name and Hostname
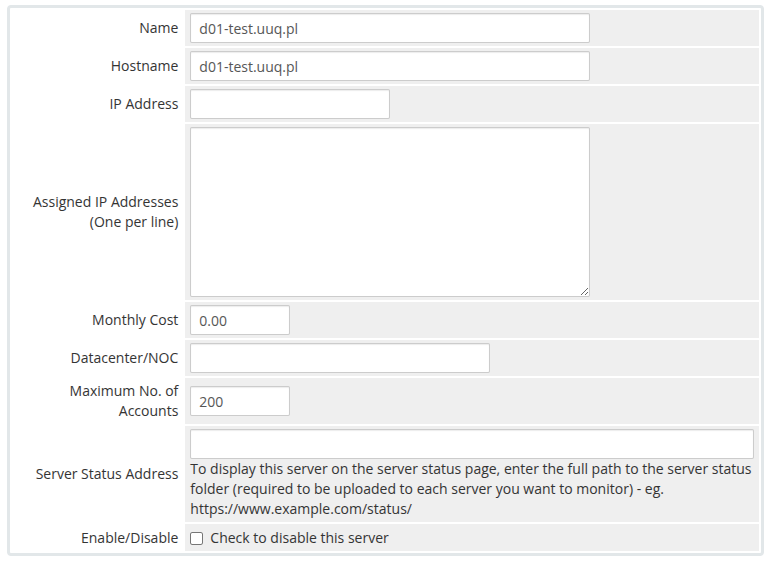
Attention: Important Information
The hostname field represents the actual domain of the server running Docker and must match the server_domain parameter in the n8n workflow. If they do not match, communication will not function correctly.
Additionally, this domain must be configured so that all its subdomains resolve to the IP address of the server running Docker.
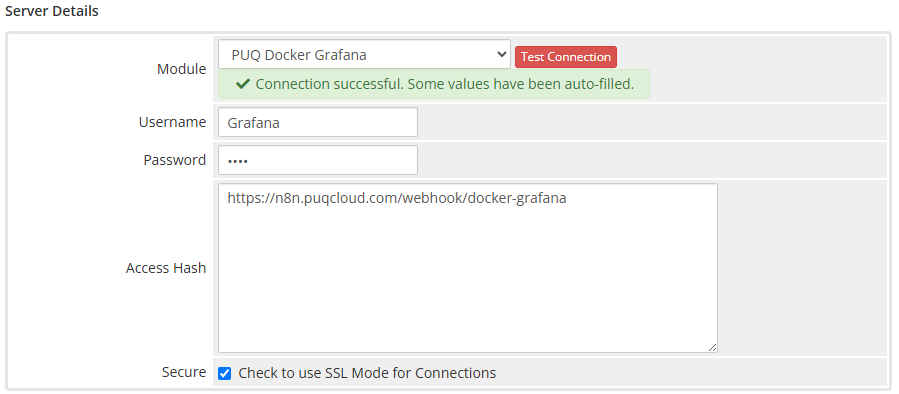
In the Server Details section, select the "PUQ Docker Grafana" module and enter the correct username and password for the API endpoint in the n8n workflow.
Additionally, in the Access Hash field, insert the URL of the API entry point for the n8n workflow.
Product Configuration
Docker Grafana module WHMCS
Order now | Download | FAQ | n8n
Add new product to WHMCS
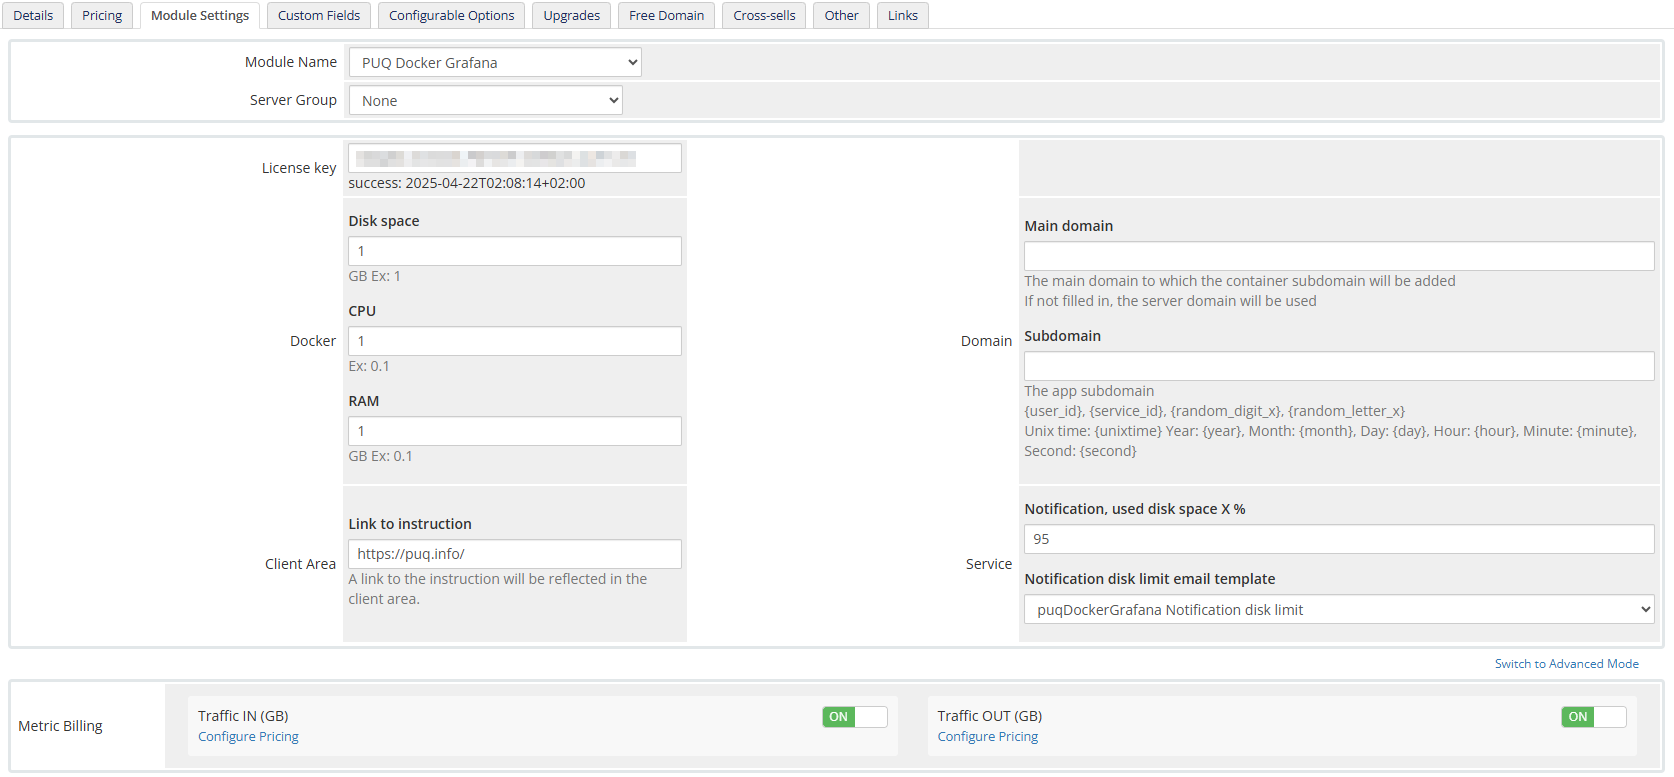
System Settings->Products/Services->Create a New ProductIn the Module settings section, select the "PUQ Docker Grafana" module
- License key – A pre-purchased license key for the "PUQ Docker Grafana" module. For the module to work correctly, the key must be active
- Disk space – defines the allocated disk size for the Docker container.
- CPU – sets the CPU usage limit for the Docker container.
- RAM – specifies the amount of RAM allocated to the Docker container.
- Link to instruction – URL to a guide that will be displayed in the client panel if provided.
- Main domain – defines the primary domain for the web interface of the application. If not set, the main domain will be taken from the hostname parameter in the server settings.
- Subdomain – a personal subdomain assigned to each service. If left empty or if the subdomain is already taken, it will be automatically generated in the format {user_id}-{service_id}.
-
Supported Macros for App Subdomain:
- {user_id} – Client ID
- {service_id} – Service ID
- {random_digit_x} – Random number (x defines the length)
- {random_letter_x} – Random letter (x defines the length)
- {unixtime} – Unix timestamp
- {year}, {month}, {day}, {hour}, {minute}, {second} – Date and time values
- Notification, used disk space X % – The percentage value that sets the threshold for the container's disk space usage will trigger a notification message to the client once the threshold is reached.
- Notification disk limit email template – The email template for the notification that will be sent when the threshold is reached.

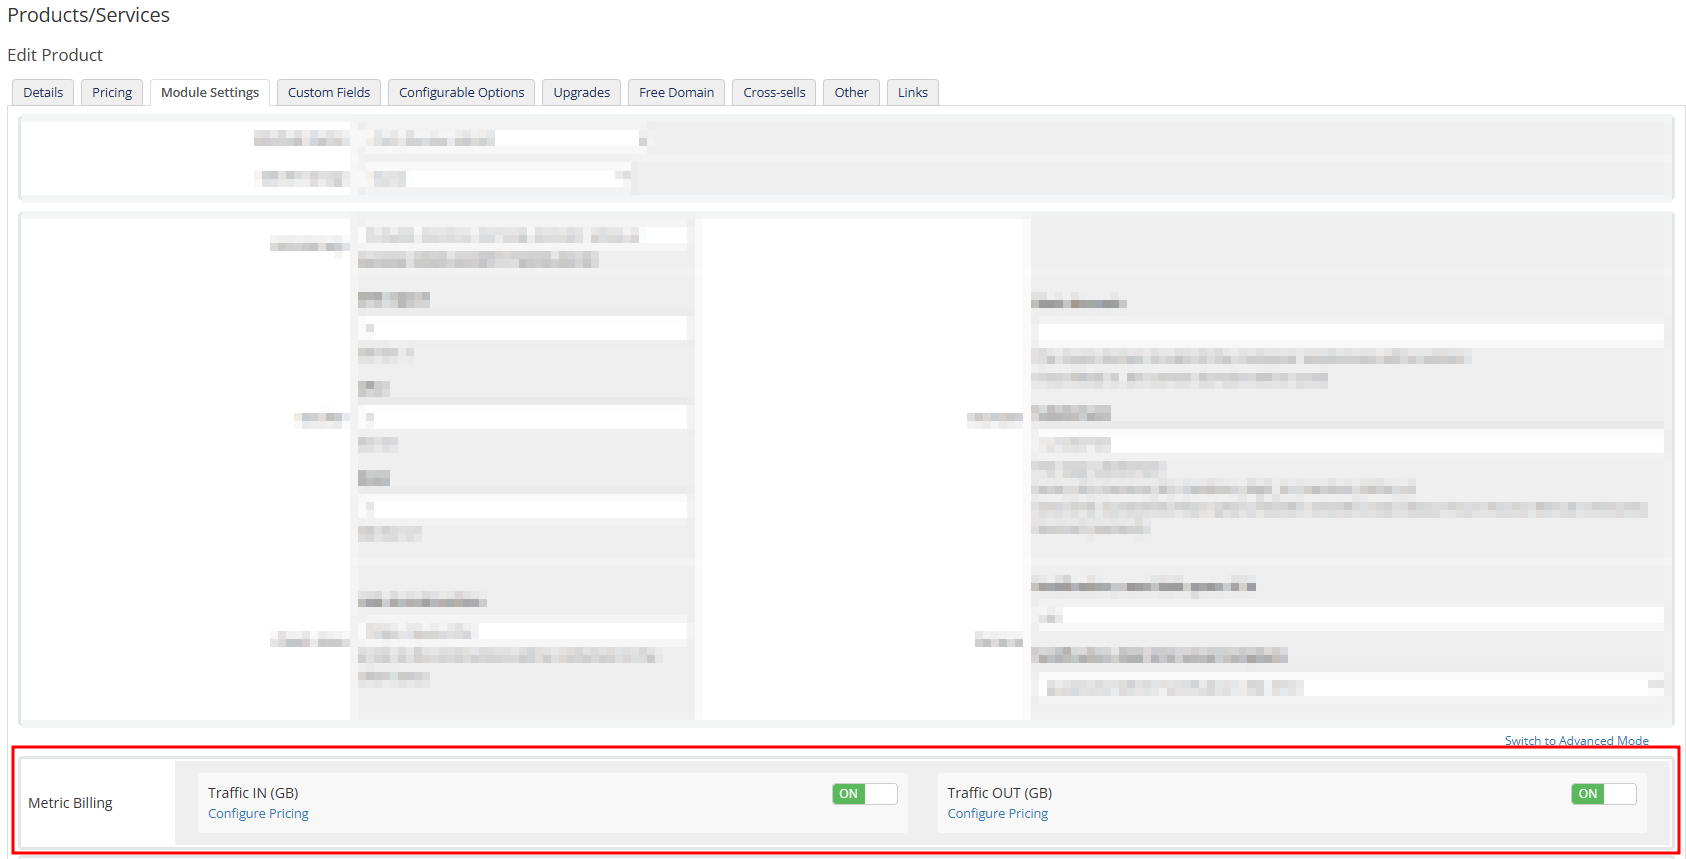
Metric Billing
Docker Grafana module WHMCS
Order now | Download | FAQ | n8n
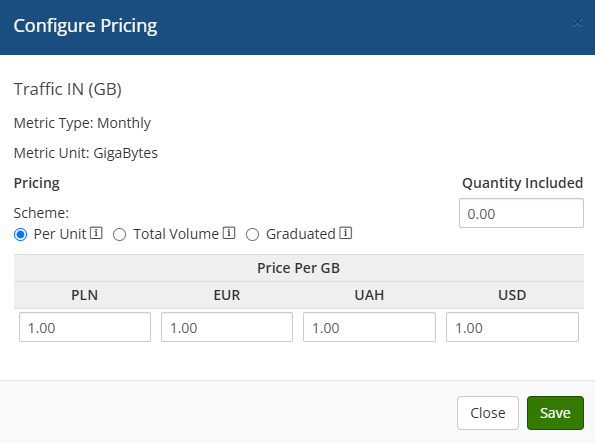
To bill certain metrics separately, you can use the standard WHMCS Metric Billing mechanism.
To configure it, you need to enable the required metrics and set the desired prices. Metrics work based on the standard WHMCS mechanism, the description of which can be found here:
https://docs.whmcs.com/products/configuration-options/usage-billing/
Email Template (puqDockerGrafana Welcome Email)
Docker Grafana module WHMCS
Order now | Download | FAQ | n8n
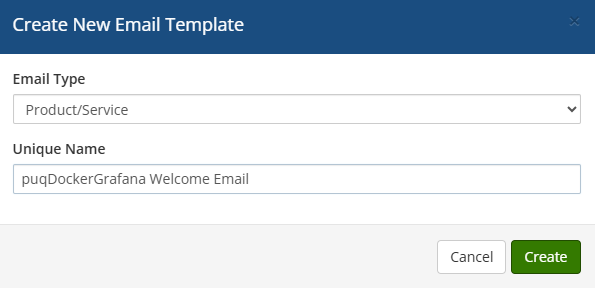
Create an email template for customer notifications.
System Settings->Email Templates->Create New Email Template- Email Type: Product/service
- Unique Name: puqDockerGrafana Welcome Email
Subject:
Grafana Order InformationBody:
Dear {$client_name},

Your order has been accepted for implementation.

Product/Service: {$service_product_name}
Payment Method: {$service_payment_method}
Amount: {$service_recurring_amount}
Billing Cycle: {$service_billing_cycle}
Next Due Date: {$service_next_due_date}


The installation and setup of your Grafana instance is in progress.
Within the next 4-5 minutes, you will be able to use your Grafana instance.

Upon your first login, you will need to create an account.

Here is the link to your Grafana server.

https://{$service_domain}/

Thank you for choosing us.

{$signature}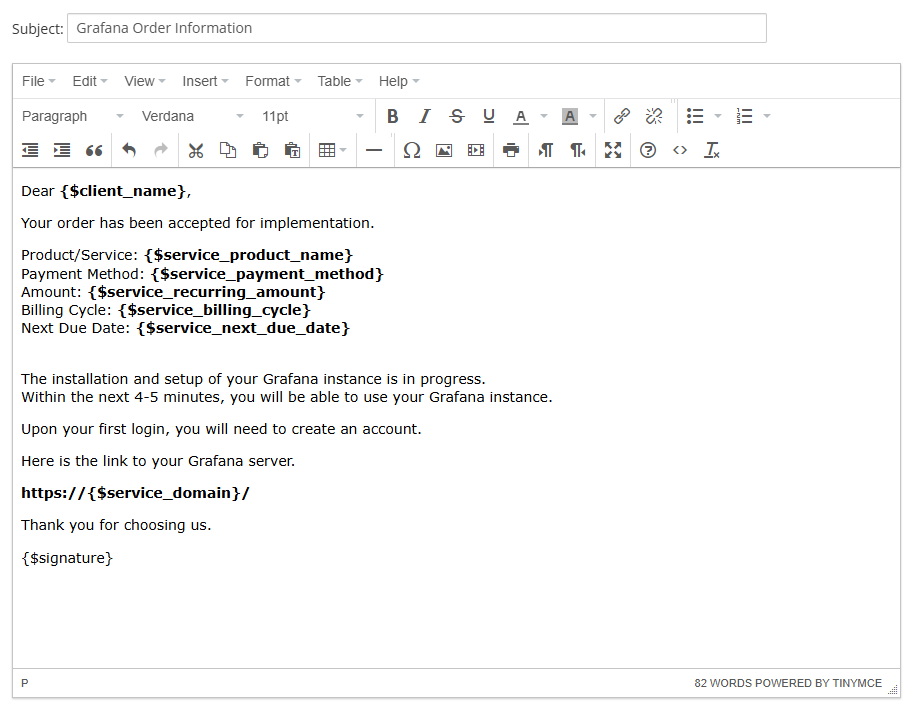
Email Template (puqDockerGrafana Update Email)
Docker Grafana module WHMCS
Order now | Download | FAQ | n8n
Create an email template for customer notifications.
System Settings->Email Templates->Create New Email Template- Email Type: Product/service
- Unique Name: puqDockerGrafana Update Email
Subject:
Grafana Update InformationBody:
Dear {$client_name},

Your instance is currently being updated.
You will be able to use your Grafana server again within 3 minutes.

Here is the link to your Grafana server.

https://{$service_domain}/
Thank you for choosing us.

{$signature}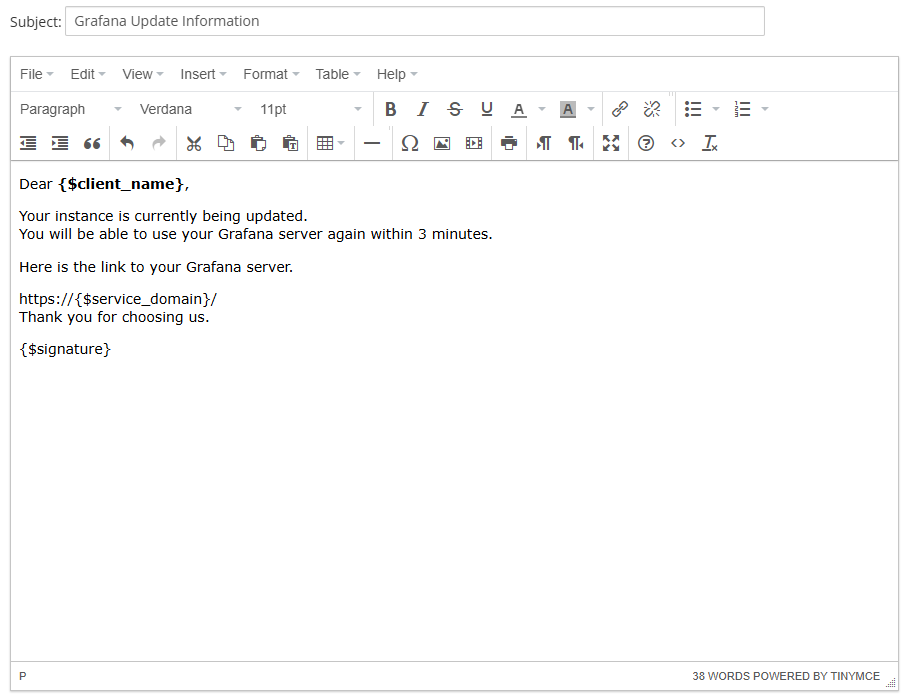
Email Template (puqDockerGrafana Notification disk limit)
Docker Grafana module WHMCS
Order now | Download | FAQ | n8n
Create an email template for customer notifications.
System Settings->Email Templates->Create New Email Template- Email Type: Product/service
- Unique Name: puqDockerGrafana Notification disk limit
Subject:
Disk space usage {$disk_used_percentage}%Body:
Dear {$client_name},

We want to inform you that your Grafana service is running low on disk space.
Please take action to prevent service interruptions.

Service Details:

Product/Service: {$service_product_name}
Domain: {$service_domain}
Total Disk Space: {$disk_total}
Used Disk Space: {$disk_used} ({$disk_used_percentage}%)
Consider freeing up space or upgrading your plan if needed.

{$signature}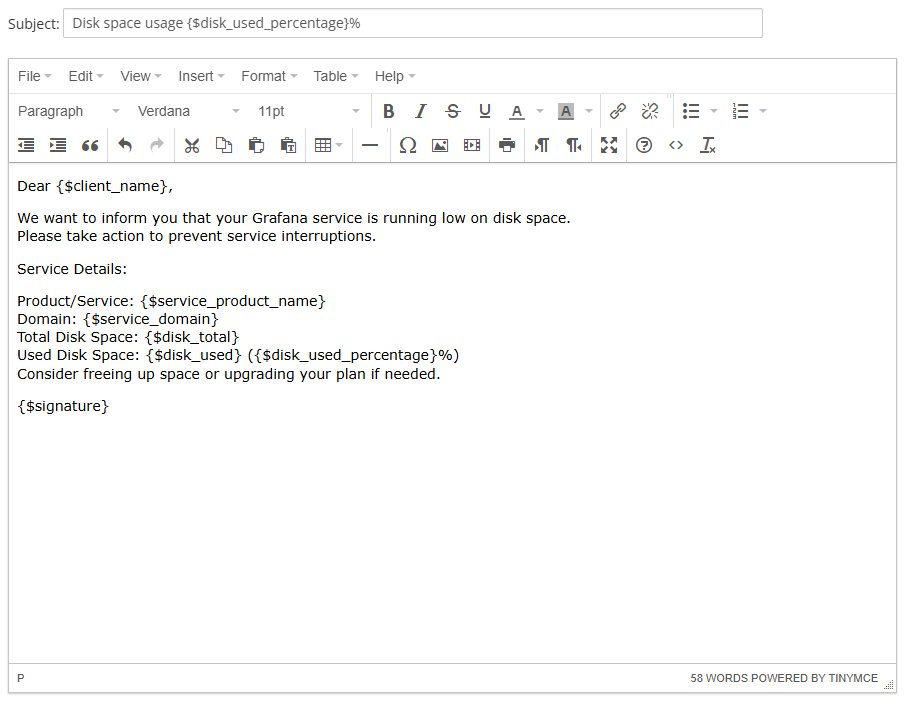
Admin Area
Product Information
Docker Grafana module WHMCS
Order now | Download | FAQ | n8n
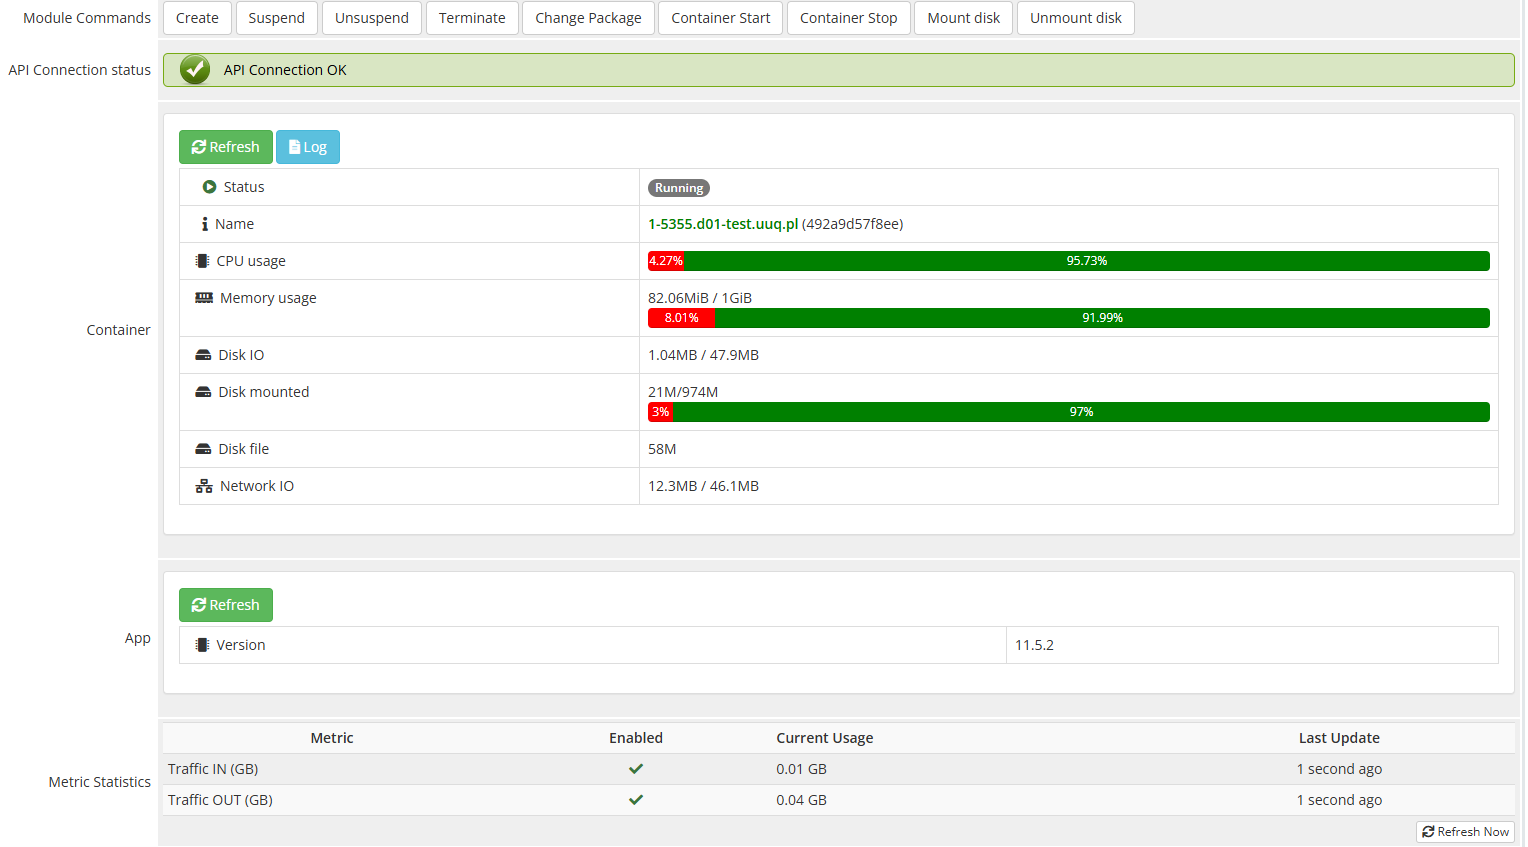
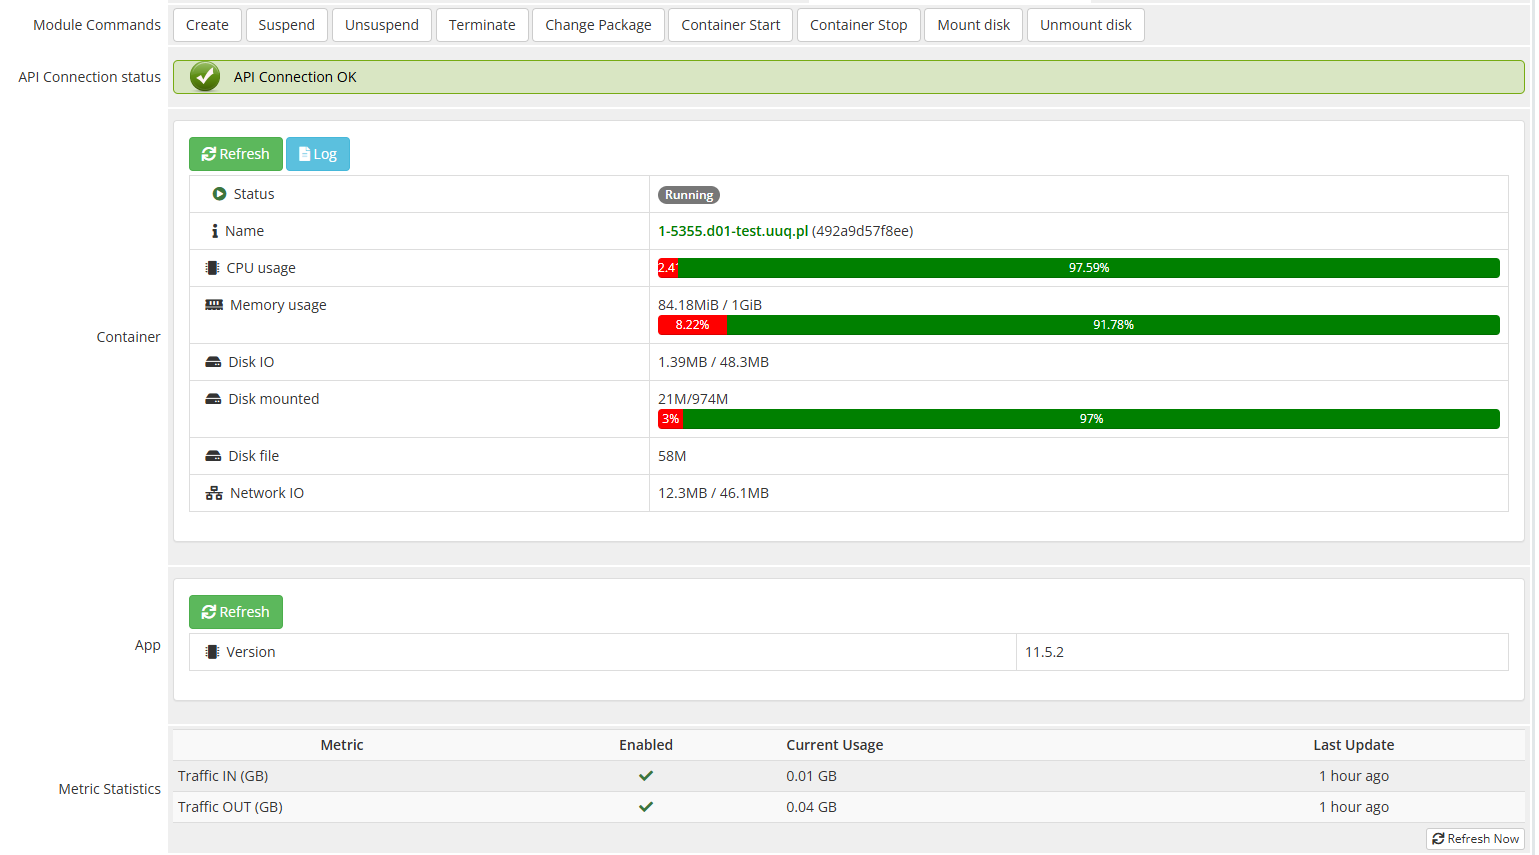
Admin Panel – Container Management Overview
The admin panel is structured into two main sections with additional control buttons for container management.
Control Buttons
- Container Start / Stop – Start or stop the running container.
- Mount Disk / Unmount Disk – Attach or detach the container's disk to the host system. This modifies the fstab file to ensure proper mounting.
Container Status & Resource Monitoring
- Status – Displays the current state (Running / Stopped).
- Name – Unique identifier and domain of the container.
- CPU Usage – Shows current CPU load.
- Memory Usage – Displays RAM consumption in real-time.
- Disk IO & Disk Mounted – Tracks disk input/output operations.
- Disk File – Indicates the actual disk image size.
- Network IO – Shows network traffic statistics.
- Log Button – Loads and displays the container logs for debugging and monitoring.
Application Information
- Version – Displays the installed application version.
Client Area
Home screen
Docker Grafana module WHMCS
Order now | Download | FAQ | n8n
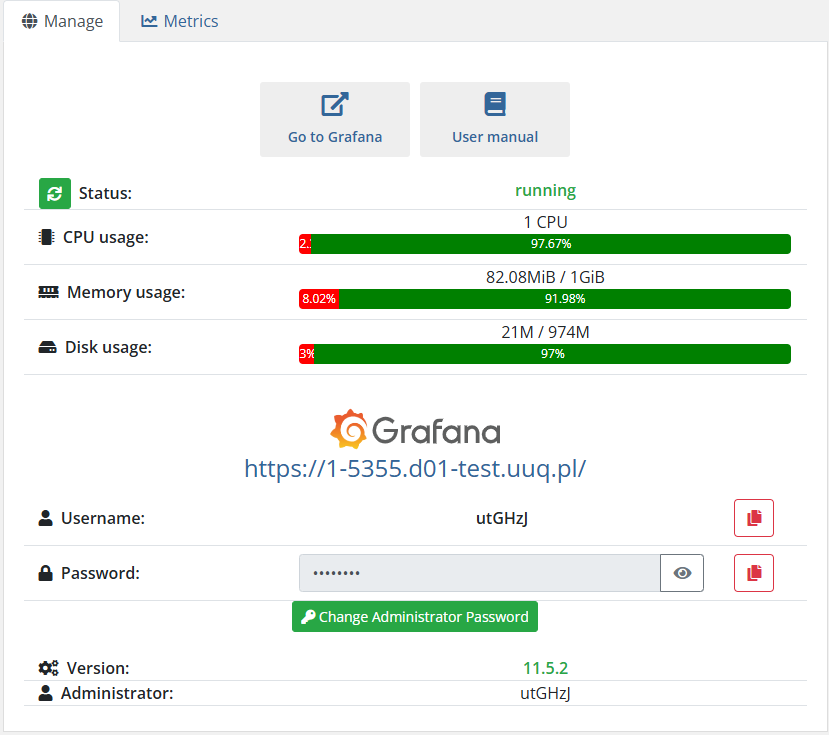
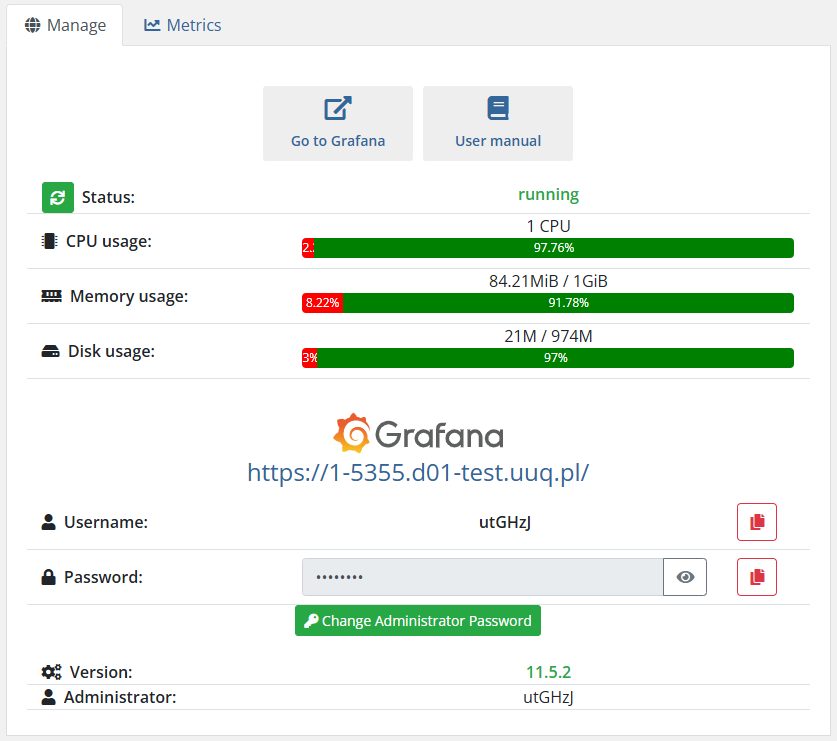
Client Area Overview – Logical Structure
The main screen of the client area is divided into three logical sections:
This clear structure ensures that users have quick access to their application, real-time monitoring of resource usage, and essential management functions in one place.
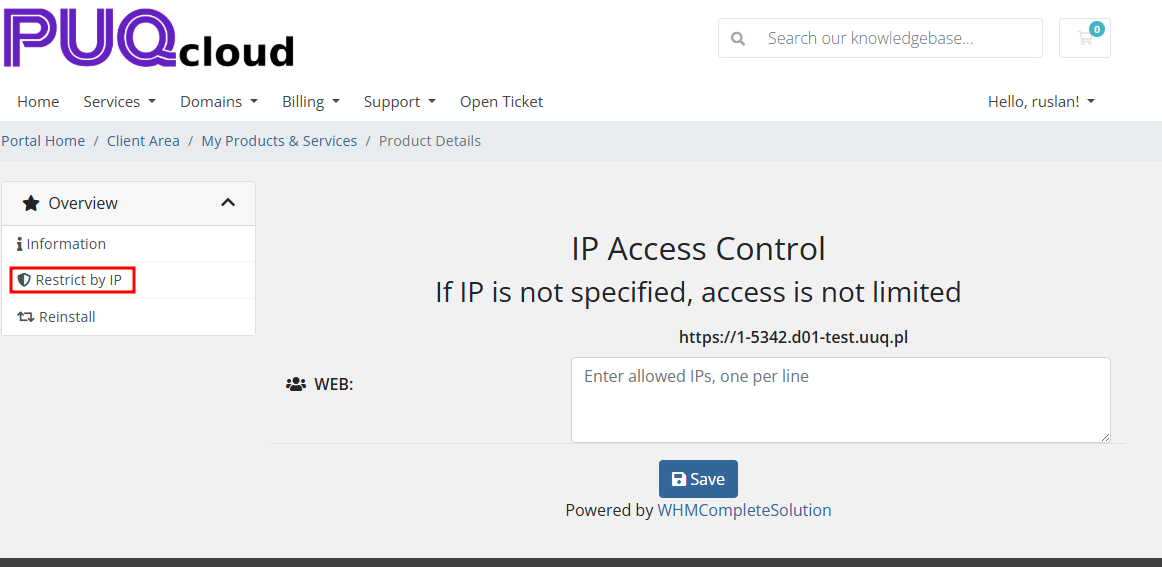
IP Access Control
Docker Grafana module WHMCS
Order now | Download | FAQ | n8n
In the client area, the client can configure access to their resource by entering allowed IP addresses in the appropriate section on the Restrict by IP page.
If no IP addresses are specified, access is open to all IP addresses.
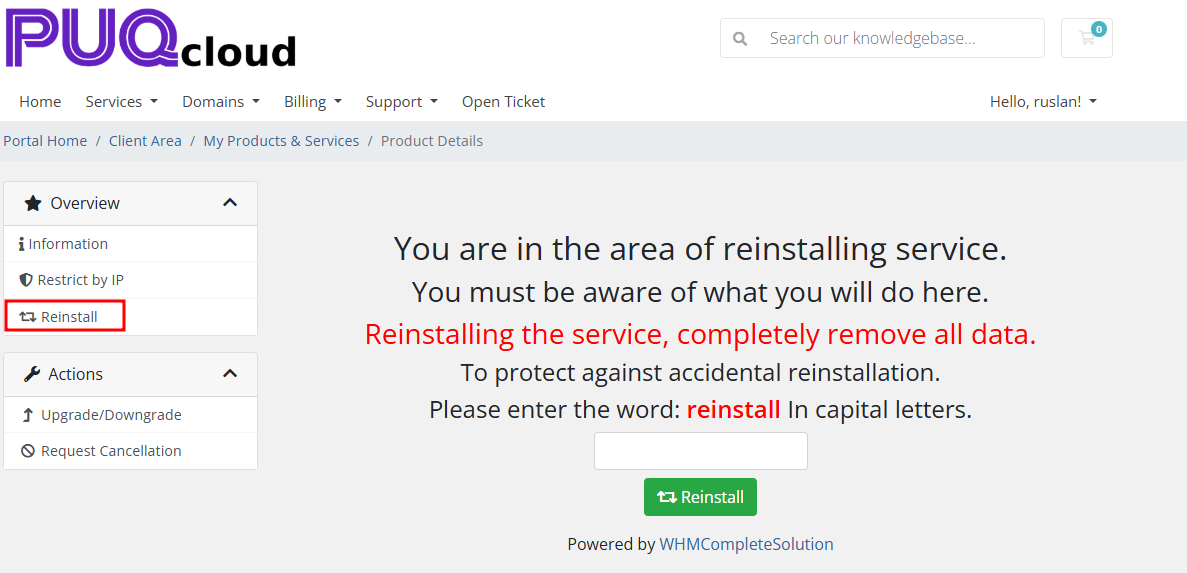
Reinstall
Docker Grafana module WHMCS
Order now | Download | FAQ | n8n
The client has the option to fully reinstall the application, which will result in complete data loss.
This action can be performed on the Reinstall page, which also includes protection against accidental reinstallation.
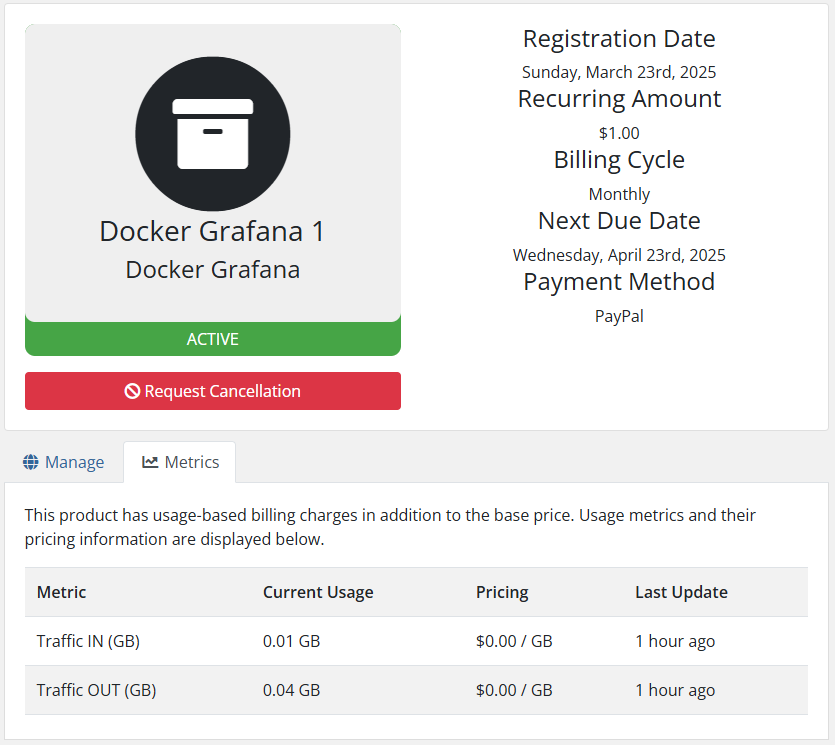
Metrics
Docker Grafana module WHMCS
Order now | Download | FAQ | n8n
If you use metrics for application traffic billing, the Metrics tab will display the usage statistics for the metrics.