What is Grafana
Docker Grafana module WHMCS
Order now | Download | FAQ | n8n
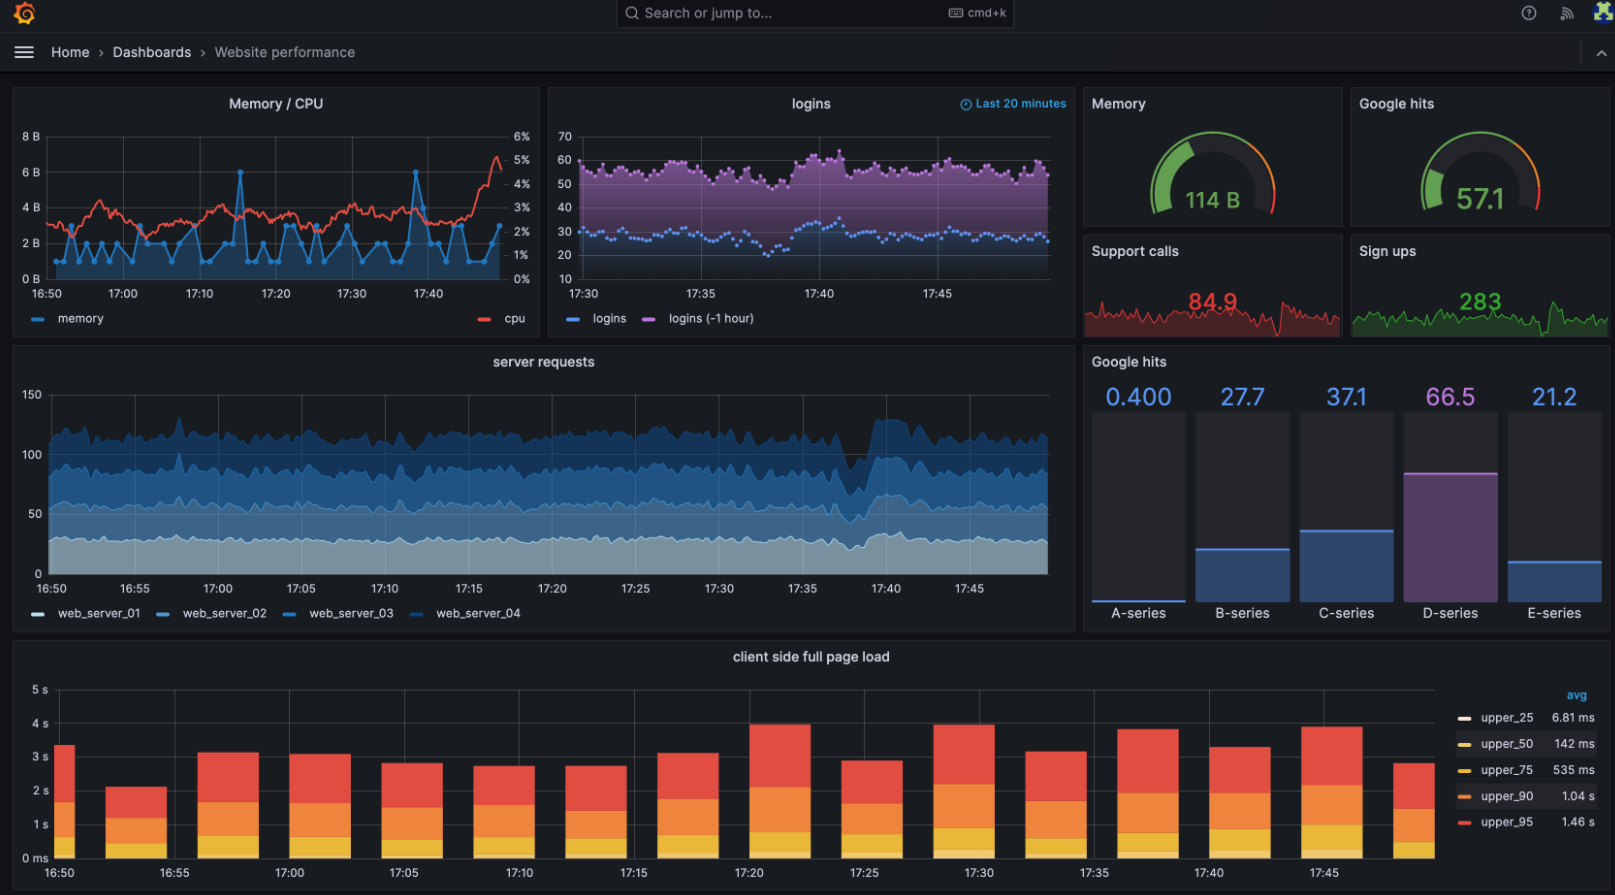
Grafana is an open-source platform for monitoring, visualization, and analysis of time-series data. It allows users to create dashboards and graphs to gain insights from various data sources in real-time. Originally developed by Torkel Ödegaard in 2014, Grafana has grown into one of the most popular tools for observability and analytics, used by developers, IT operations teams, and businesses worldwide.
Key Features of Grafana
- Custom Dashboards – Users can build interactive dashboards with panels that display data from multiple sources.
- Wide Range of Data Sources – Supports Prometheus, InfluxDB, Elasticsearch, MySQL, PostgreSQL, Loki, and many more.
- Alerting System – Configurable alerts with notifications via Slack, PagerDuty, email, and other channels.
- User Management & Authentication – Role-based access control (RBAC) and integration with OAuth, LDAP, and other authentication systems.
- Plugins & Extensibility – Numerous plugins available for additional visualizations and data sources.
- Annotations – Add context to graphs with notes about specific events.
- Multi-Tenancy – Supports multiple organizations with isolated dashboards and data sources.
- Enterprise Support – A commercial version provides enhanced security, scalability, and team collaboration features.
Where is Grafana Used?
Grafana is widely used in various industries and IT environments, including:
1. IT Infrastructure Monitoring
- Used for tracking system performance, CPU usage, memory consumption, network statistics, and application uptime.
- Works with Prometheus, Zabbix, and Nagios to visualize real-time metrics.
2. Cloud & DevOps Monitoring
- Monitors Kubernetes clusters, Docker containers, and cloud-based services like AWS, Azure, and Google Cloud.
- Helps DevOps teams with CI/CD pipelines by integrating with Jenkins, GitLab CI/CD, and other tools.
3. Application Performance Monitoring (APM)
- Monitors application logs, traces, and request latencies by integrating with Loki, Jaeger, and OpenTelemetry.
- Helps developers diagnose performance bottlenecks and optimize application behavior.
4. Business Analytics & Finance
- Used in financial institutions for tracking market trends, sales performance, and operational analytics.
- Can visualize data from SQL databases like MySQL and PostgreSQL for business intelligence purposes.
5. IoT and Industrial Monitoring
- Monitors sensor data from IoT devices in real-time.
- Used in industries like manufacturing, energy, and smart cities to track environmental conditions and equipment status.
What Data Sources Can Grafana Work With?
Grafana supports a wide variety of data sources, making it a highly flexible visualization tool:
- Time-Series Databases: Prometheus, InfluxDB, Graphite
- SQL Databases: MySQL, PostgreSQL, Microsoft SQL Server
- Logging and Tracing Tools: Elasticsearch, Loki, Jaeger, OpenTelemetry
- Cloud Services: AWS CloudWatch, Google Cloud Monitoring, Azure Monitor
- Monitoring Tools: Zabbix, Nagios, New Relic, Datadog
- IoT and Industrial Data: OPC-UA, MQTT, ThingsBoard
How Grafana Works
Grafana operates as a web-based application, typically deployed as a service accessible via a browser. The workflow involves:
- Connecting Data Sources: Configure one or more data sources like Prometheus, InfluxDB, or MySQL.
- Building Dashboards: Create panels displaying metrics in graphs, tables, or heatmaps.
- Setting Alerts: Define thresholds and notification channels for real-time alerts.
- User Access Management: Configure authentication and permissions for different users and teams.
- Extending with Plugins: Add visualization types, new data sources, or integrations with external systems.
Conclusion
Grafana is a powerful and versatile tool for visualizing and monitoring data across various domains. Its ability to integrate with numerous data sources and provide interactive dashboards makes it an essential tool for IT professionals, developers, and businesses. Whether you need to monitor cloud infrastructure, track application performance, analyze business data, or oversee industrial processes, Grafana provides an intuitive and highly customizable solution.


No Comments