 Skip to main content
Traffic Statistics
Mikrotik VPN module WHMCS
Order now | Download | Community
Traffic Usage Metrics
The client can view historical traffic usage statistics by navigating to the Traffic statistics tab in the sidebar menu of the VPN service overview.
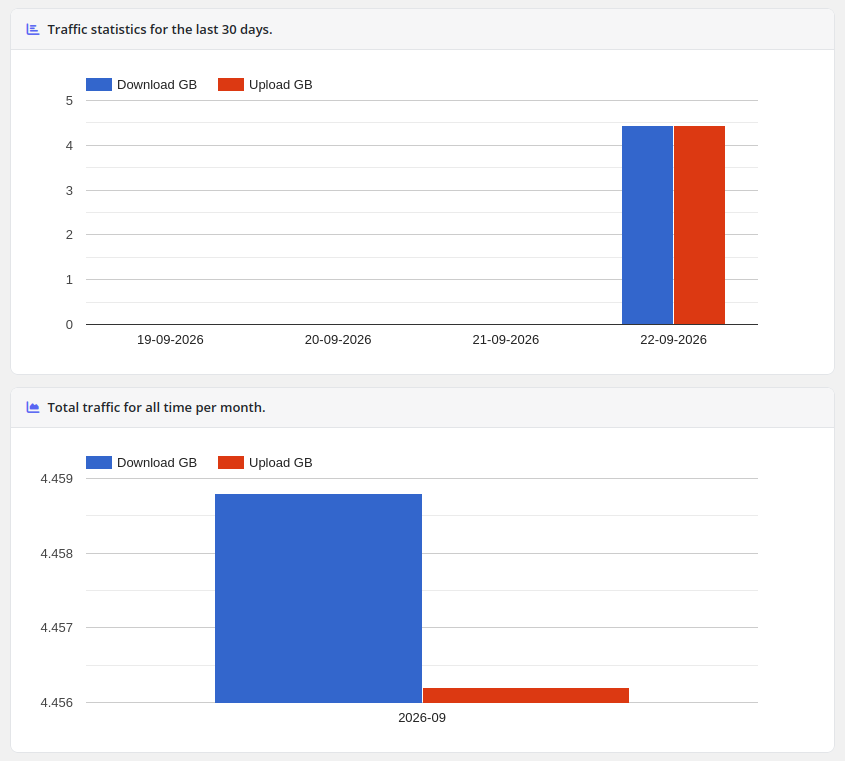
The statistics page presents visual representations of the client's traffic usage over time, dynamically generated using charting libraries:
-
Traffic statistics for the last 30 days: A bar chart displaying daily bandwidth consumption, differentiating between Download GB (blue) and Upload GB (red).
-
Total traffic for all time per month: A bar chart providing a higher-level monthly aggregation of all downloaded and uploaded data for long-term usage tracking.
Note: The data powering these charts is continuously gathered by the WHMCS Cron job and securely stored in the database according to the history retention policy defined in the module's product settings.
Screenshot
 client-area-traffic.png