Home Screen
Mikrotik WireGuard VPN module WHMCS
Order now | Download | FAQ
Customers accessing their VPN service panel can view and manage their WireGuard VPN connection.
Action Buttons
At the top of the page, the following buttons are displayed:
- VPN client — link to WireGuard client downloads (if configured by administrator)
- User manual — link to setup instructions (if configured by administrator)
- Reset VPN Interface — reboot the VPN interface to reset a frozen connection
Network Configuration
Displays the VPN service status and settings:
- Enable — shows whether the VPN peer is enabled or disabled
- VPN Protocol — always "WireGuard"
- Bandwidth download/upload — the configured speed limits in Mb/s
Connection Status
Real-time information about the VPN connection:
- Endpoint — the client's current IP address and port (shown when connected)
- Latest handshake — timestamp of the last successful WireGuard handshake
- Transfer RX — data received by the peer
- Transfer TX — data sent by the peer
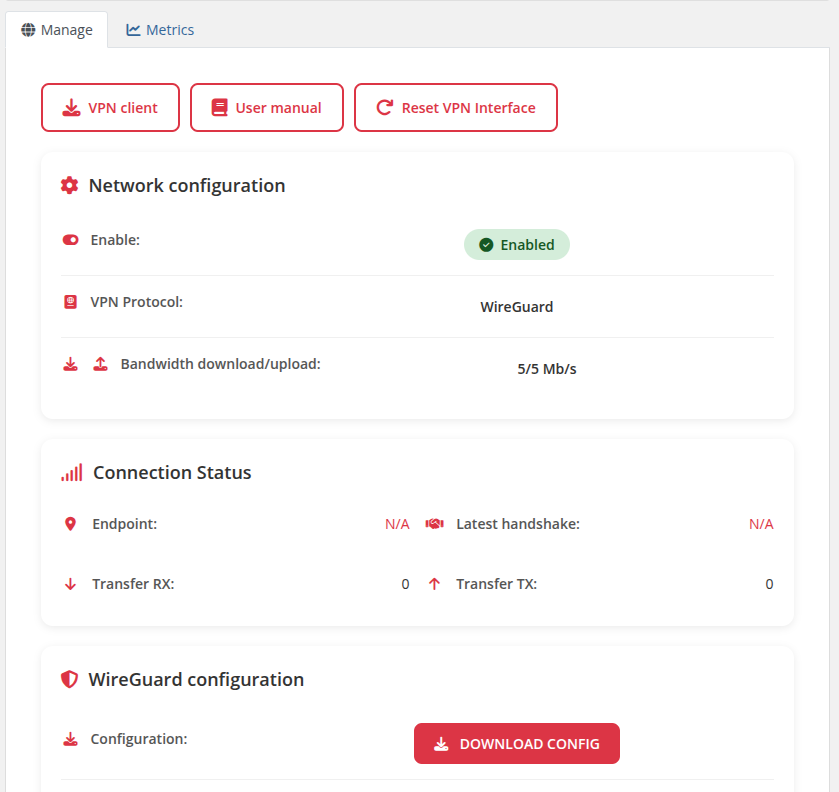
Client area overview showing action buttons, network configuration, and connection status
WireGuard Configuration
Provides the client with everything needed to configure their WireGuard client:
-
DOWNLOAD CONFIG button — downloads the
wg0.confconfiguration file - QR Code — scannable QR code for mobile WireGuard apps
- Configuration text — the full WireGuard configuration in text format
The configuration includes:
[Interface]
Address = <client VPN IP>
DNS = <configured DNS servers>
PrivateKey = <client private key>

[Peer]
PersistentKeepalive = <configured keepalive>
Endpoint = <server hostname>:<WireGuard listen port>
PublicKey = <server public key>
AllowedIPs = <configured allowed IPs>
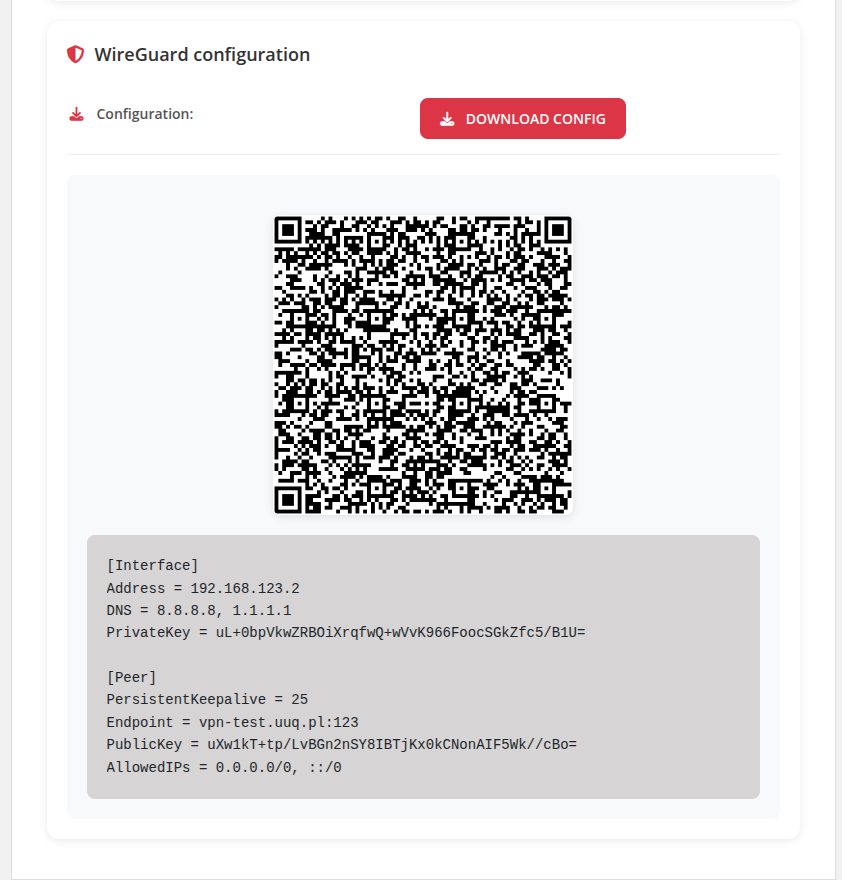
WireGuard configuration section with QR code and text config
Traffic Statistics
When traffic statistics collection is enabled (default), a Traffic statistics link appears in the sidebar navigation.
The statistics page displays two charts powered by Google Charts:
- Traffic statistics for the last 30 days — daily download and upload traffic in GB
- Total traffic for all time per month — monthly aggregated download and upload traffic in GB
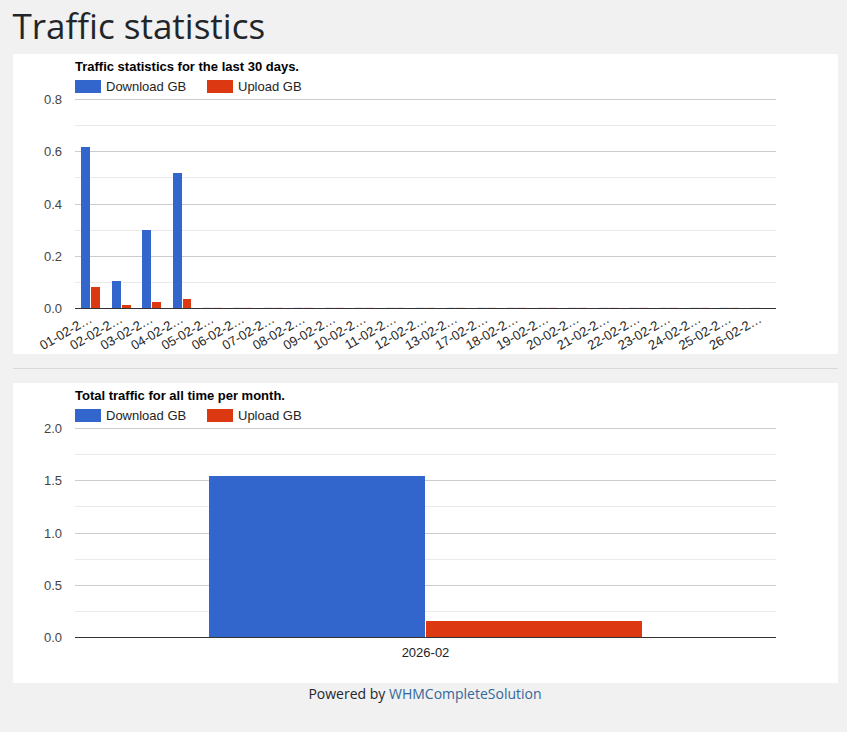
Traffic statistics page with daily and monthly charts
Note: Traffic statistics can be disabled per product in the admin settings (History > Disable statistics collection). When disabled, the sidebar link and statistics page are hidden.