Dashboard
Code Snippets addon WHMCS
Order now | Download | FAQ
The Dashboard is the home page of the module, available at: Addons > PUQ Code Snippets > Dashboard
It provides a complete overview of all your code snippets — key metrics, distribution charts, and a log of recent changes.
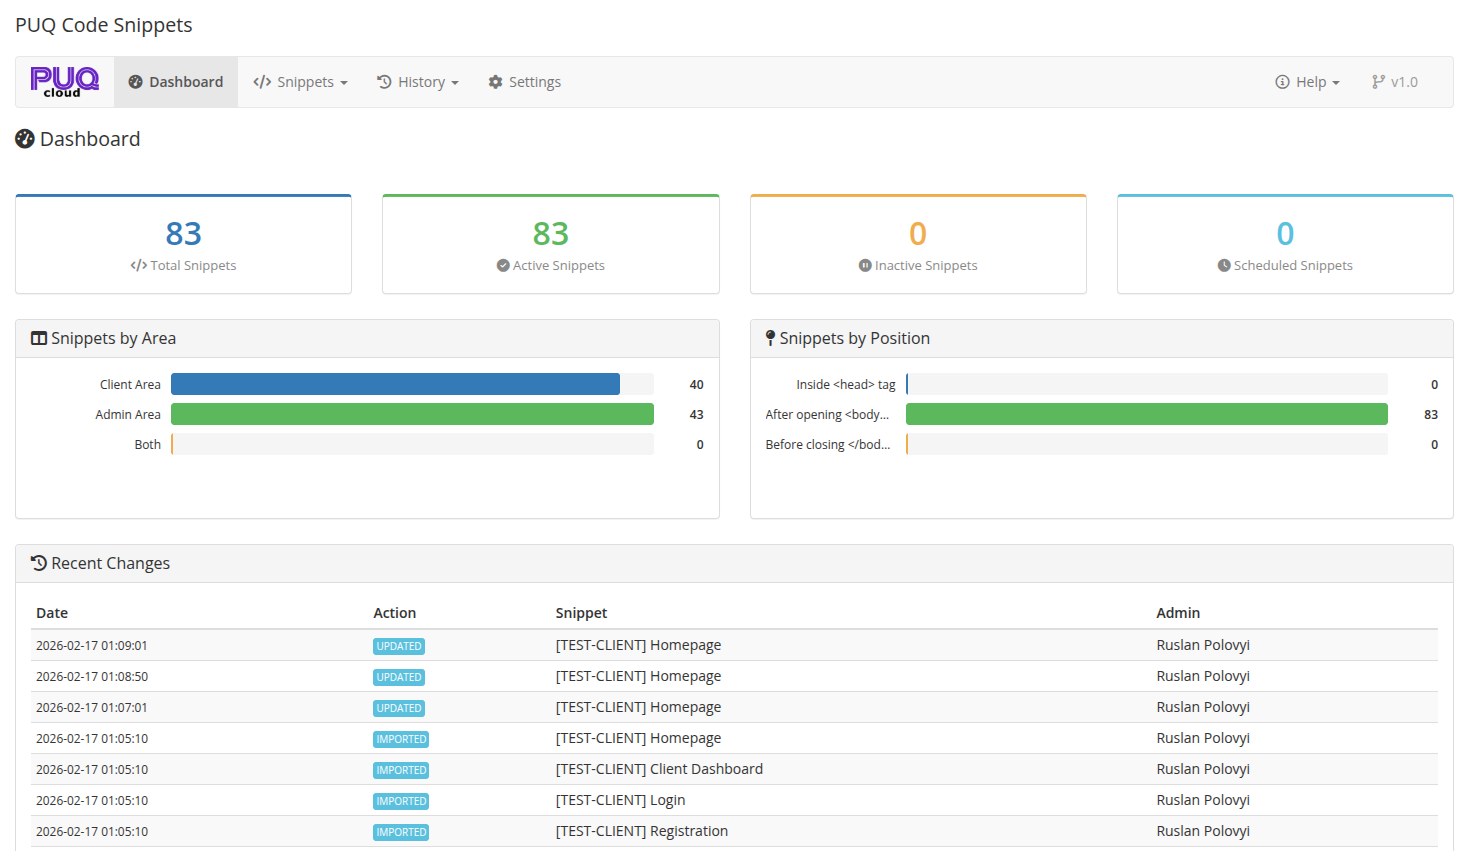 02-dashboard.png
Key Metrics
The top section displays four summary cards:
| Metric | Description |
|---|---|
| Total Snippets | Total number of snippets in the system |
| Active Snippets | Snippets that are currently enabled and will be injected |
| Inactive Snippets | Snippets that are disabled |
| Scheduled Snippets | Snippets with a future start date or an active date range |
Snippets by Area
A horizontal bar chart showing the distribution of snippets across target areas:
- Client Area — snippets targeting only the client-facing pages
- Admin Area — snippets targeting only the admin panel
- Both — snippets targeting both areas
Snippets by Position
A horizontal bar chart showing the distribution by injection position:
- Inside <head> tag — CSS, meta tags, analytics scripts
- After opening <body> — top banners, GTM noscript blocks
- Before closing </body> — chat widgets, tracking pixels, JavaScript
Recent Changes
A table showing the latest snippet modifications:
| Column | Description |
|---|---|
| Date | Timestamp of the change |
| Action | Type of change: Created, Updated, Deleted, Toggled, Restored, Imported |
| Snippet | Name of the affected snippet |
| Admin | Administrator who made the change |
This section helps you quickly see what's been modified recently without navigating to the full History page.
Kill Switch Warning
If the kill switch is active (via database setting or flag file), a prominent red alert banner appears at the top of the dashboard warning that all snippets are currently disabled. See Settings for details on the kill switch.