Dashboard
Product Analytics addon WHMCS
Order now | Download | Community
The Dashboard is the home page of the module, available at: Addons > PUQ Product Analytics > Home
It provides a complete overview of your WHMCS business at a glance — key metrics, revenue, service status, subscription trends, and top-performing products and groups.
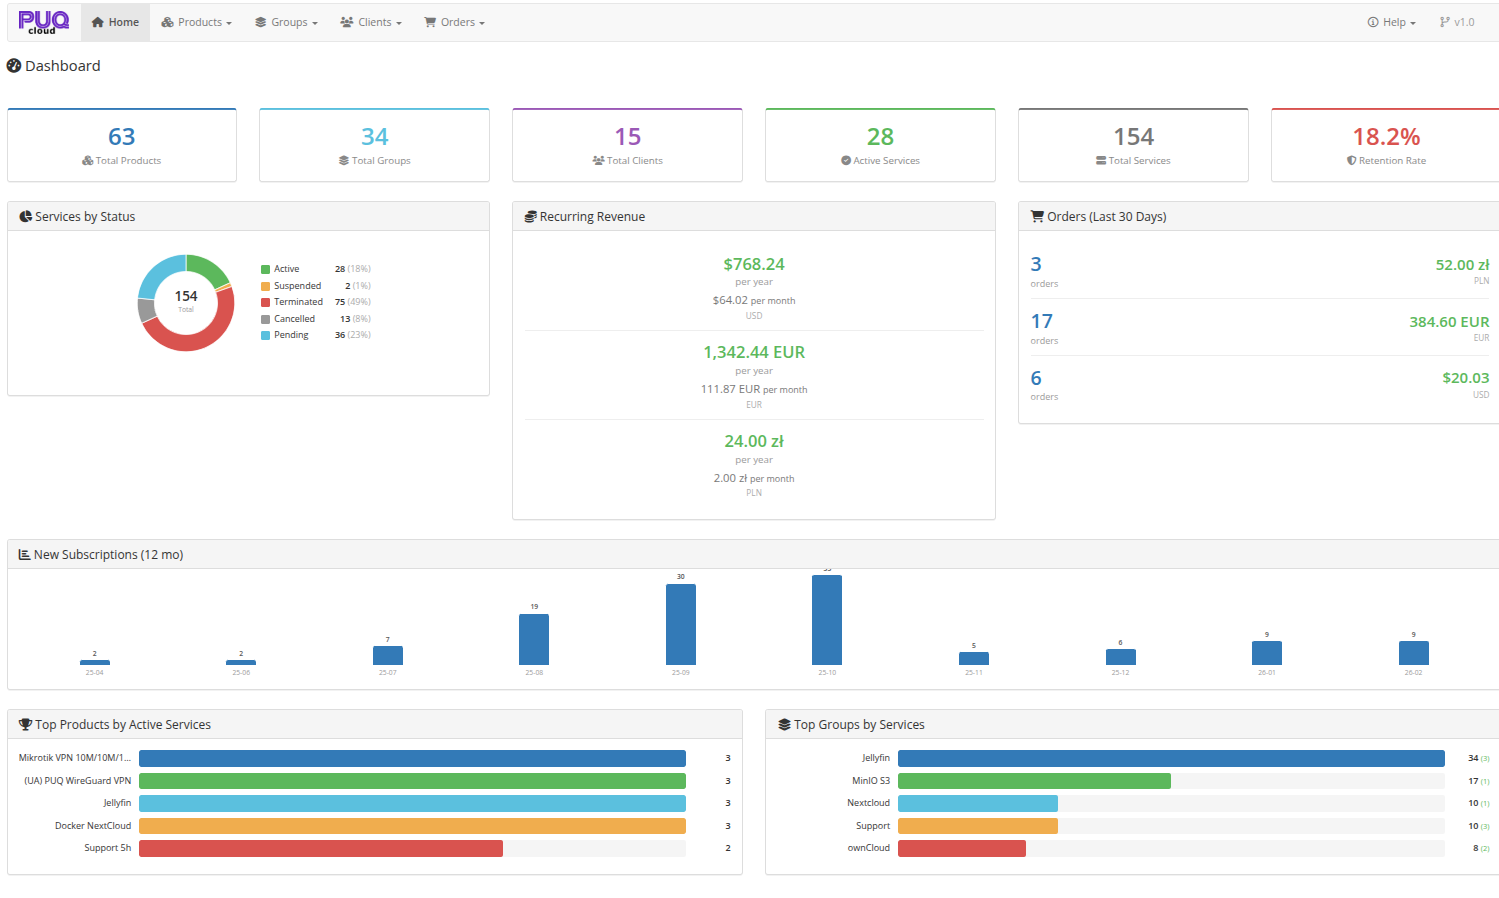 02-dashboard.png
Key Metrics
The top row displays summary cards with the most important numbers:
| Metric | Description |
|---|---|
| Total Products | Number of products configured in WHMCS |
| Total Groups | Number of product groups |
| Total Clients | Number of registered clients |
| Active Services | Services with Active status |
| Total Services | Total number of services across all statuses |
| Retention Rate | Percentage of services that remain active (color-coded: green >= 70%, yellow >= 40%, red < 40%) |
Services by Status
A donut chart showing the distribution of all services by their current status:
- Active (green) — currently running services
- Suspended (yellow) — temporarily suspended
- Terminated (red) — permanently terminated
- Cancelled (gray) — cancelled by client or admin
- Pending (blue) — awaiting activation
Recurring Revenue
Displays estimated recurring revenue broken down by currency:
- Annual Revenue — total estimated yearly revenue from active services
- Monthly Revenue — normalized monthly estimate
- Each currency is shown separately (e.g., USD, EUR, PLN)
Orders (Last 30 Days)
Summary of recent order activity per currency, showing the number of orders and their total amount.
New Subscriptions (12 mo)
A bar chart showing the number of new service subscriptions per month over the last 12 months, helping you identify growth trends.
Top Products by Active Services
A horizontal bar chart ranking products by the number of currently active services.
Top Groups by Services
A horizontal bar chart ranking product groups by total service count, with the number of active services shown in parentheses.