Charts Section Description
Hetzner Datacenter module WHMCS
Order now | Download | FAQ
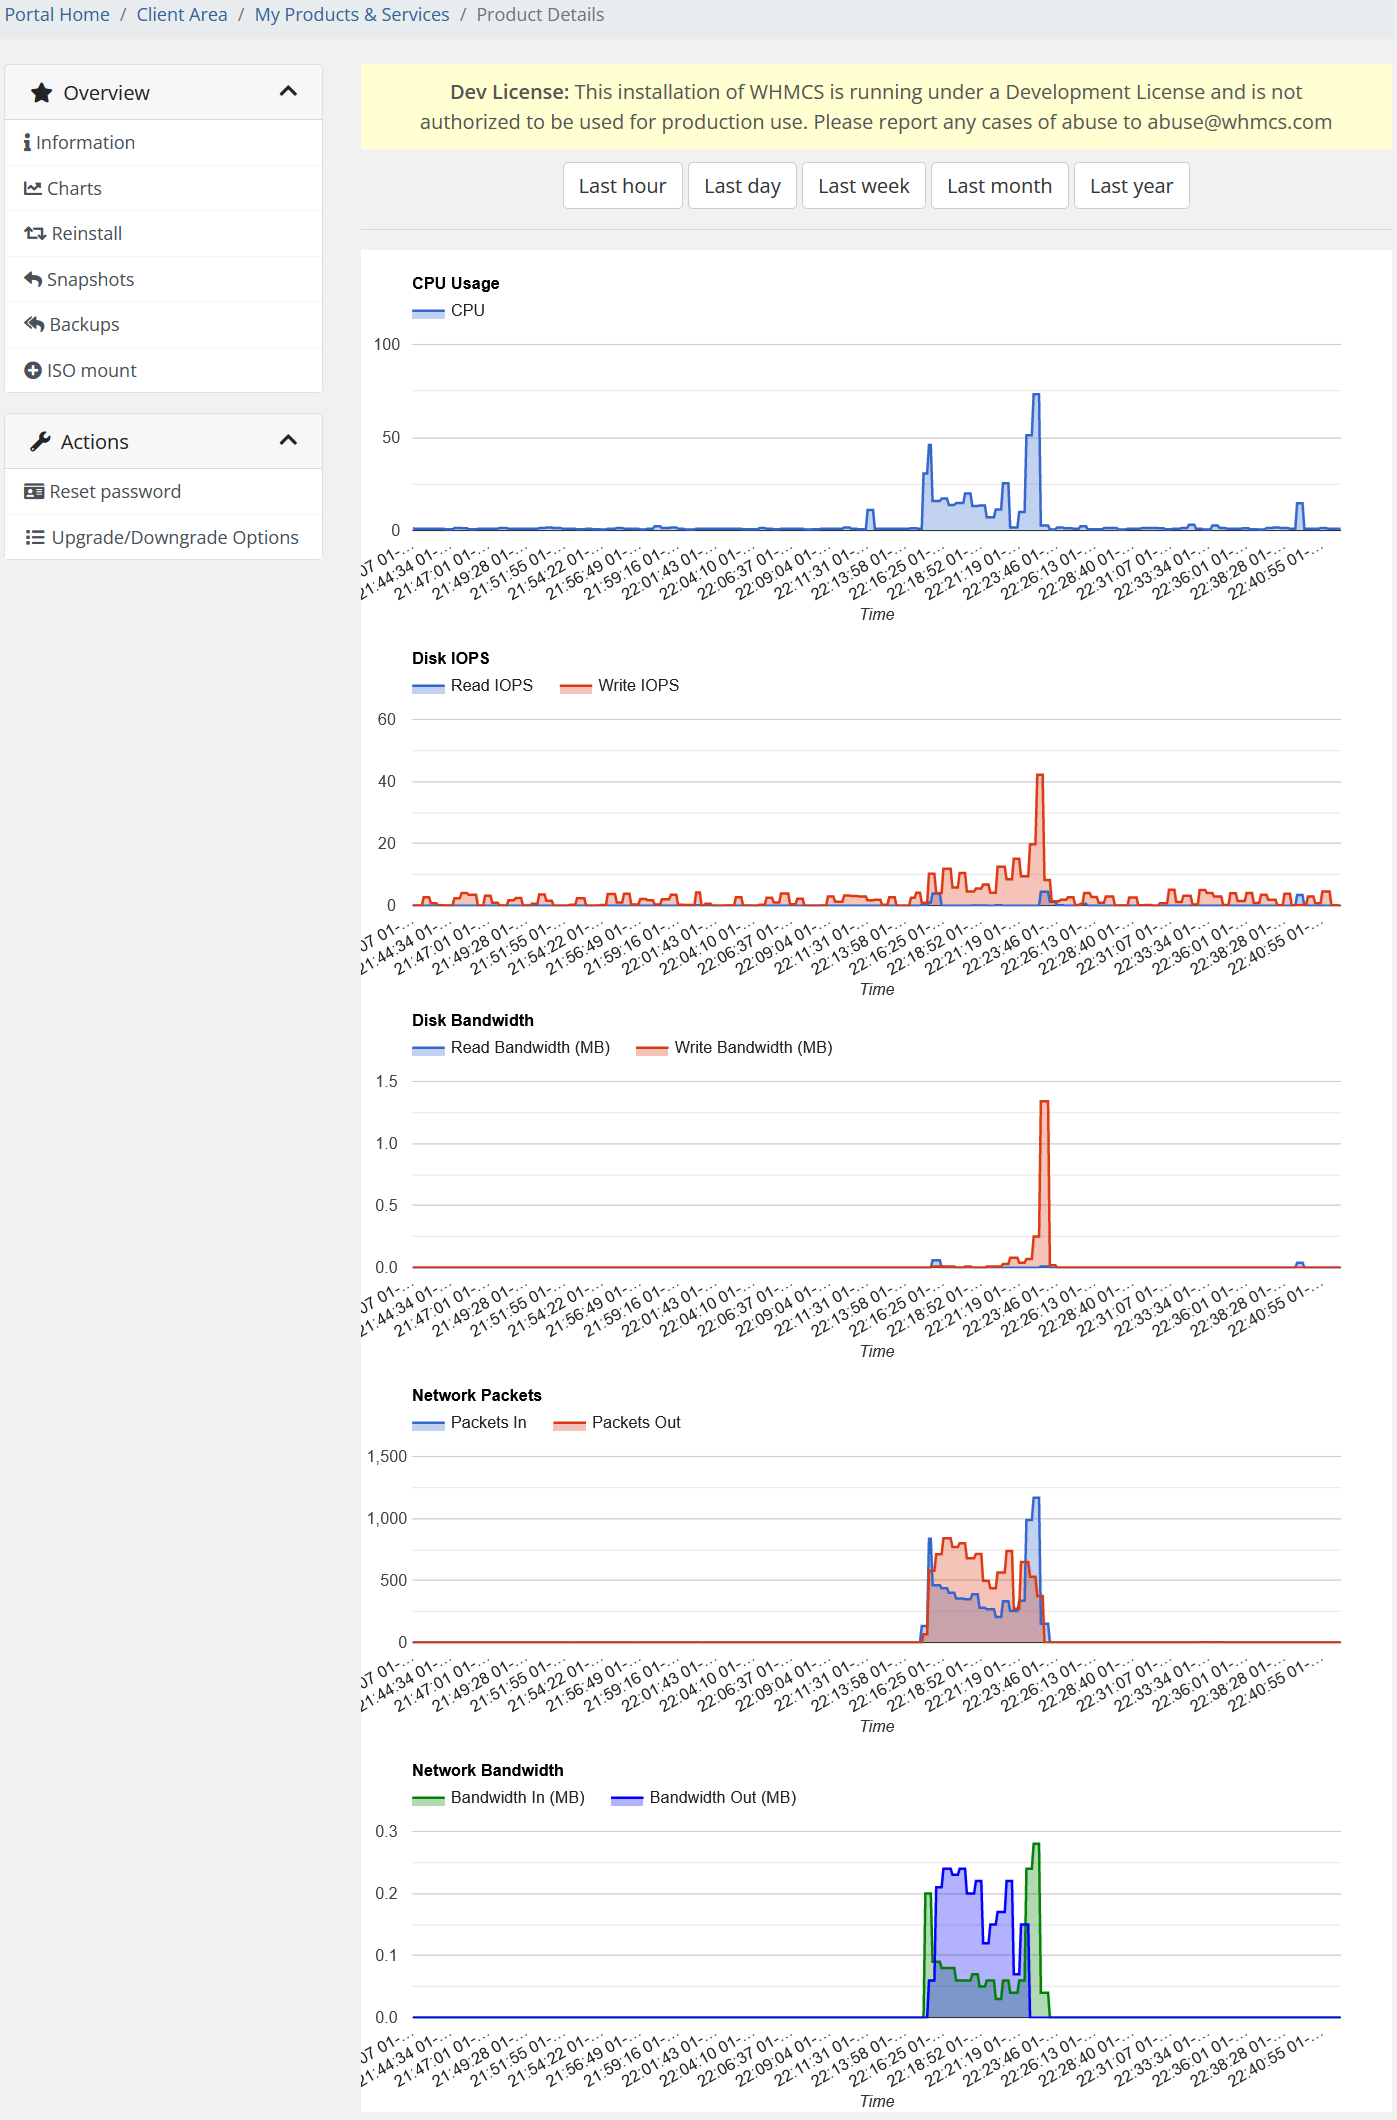
The "Charts" section provides visual representations of various performance metrics of your server over different time periods. This section is useful for monitoring and analyzing the server's resource usage and performance trends.
Available Time Frames:
At the top of the section, there are buttons that allow you to select the time frame for the displayed metrics:
- Last hour
- Last day
- Last week
- Last month
- Last year
Performance Metrics:
-
CPU Usage:
- Description: This chart shows the CPU usage over time, represented by a blue line. The vertical axis indicates the percentage of CPU usage, while the horizontal axis represents time.
- Purpose: Monitoring CPU usage helps to understand the server's processing load and identify periods of high or low activity.
-
Disk IOPS (Input/Output Operations Per Second):
- Description: This chart displays the disk IOPS, split into Read IOPS (blue) and Write IOPS (red). The vertical axis indicates the number of IOPS, and the horizontal axis represents time.
- Purpose: Tracking disk IOPS is important for understanding how frequently the disk is being accessed, which can affect the overall performance of the server, especially under high read/write operations.
-
Disk Bandwidth:
- Description: This chart shows the disk bandwidth usage, differentiated into Read Bandwidth (MB) (blue) and Write Bandwidth (MB) (red). The vertical axis shows the bandwidth in megabytes, and the horizontal axis represents time.
- Purpose: This metric helps to monitor the amount of data being read from or written to the disk, which is crucial for assessing the impact of disk operations on the server's performance.
-
Network Packets:
- Description: This chart displays the number of network packets processed by the server, with Packets In (blue) and Packets Out (red). The vertical axis shows the number of packets, and the horizontal axis represents time.
- Purpose: Tracking network packets allows you to monitor the volume of incoming and outgoing network traffic, which is essential for understanding network load and identifying any potential issues with connectivity or bandwidth.
-
Network Bandwidth:
- Description: This chart shows the network bandwidth usage, with Bandwidth In (MB) (green) and Bandwidth Out (MB) (blue). The vertical axis indicates the bandwidth in megabytes, while the horizontal axis represents time.
- Purpose: Monitoring network bandwidth usage helps to evaluate the server's network performance and ensure that it can handle the necessary data throughput without bottlenecks.