PUQ Mautic Skip to main content

Home screen

Hetzner Datacenter module WHMCS

 Order now | Download | FAQ
The end customer, after logging in to his own customer panel, has access to the following information and options:
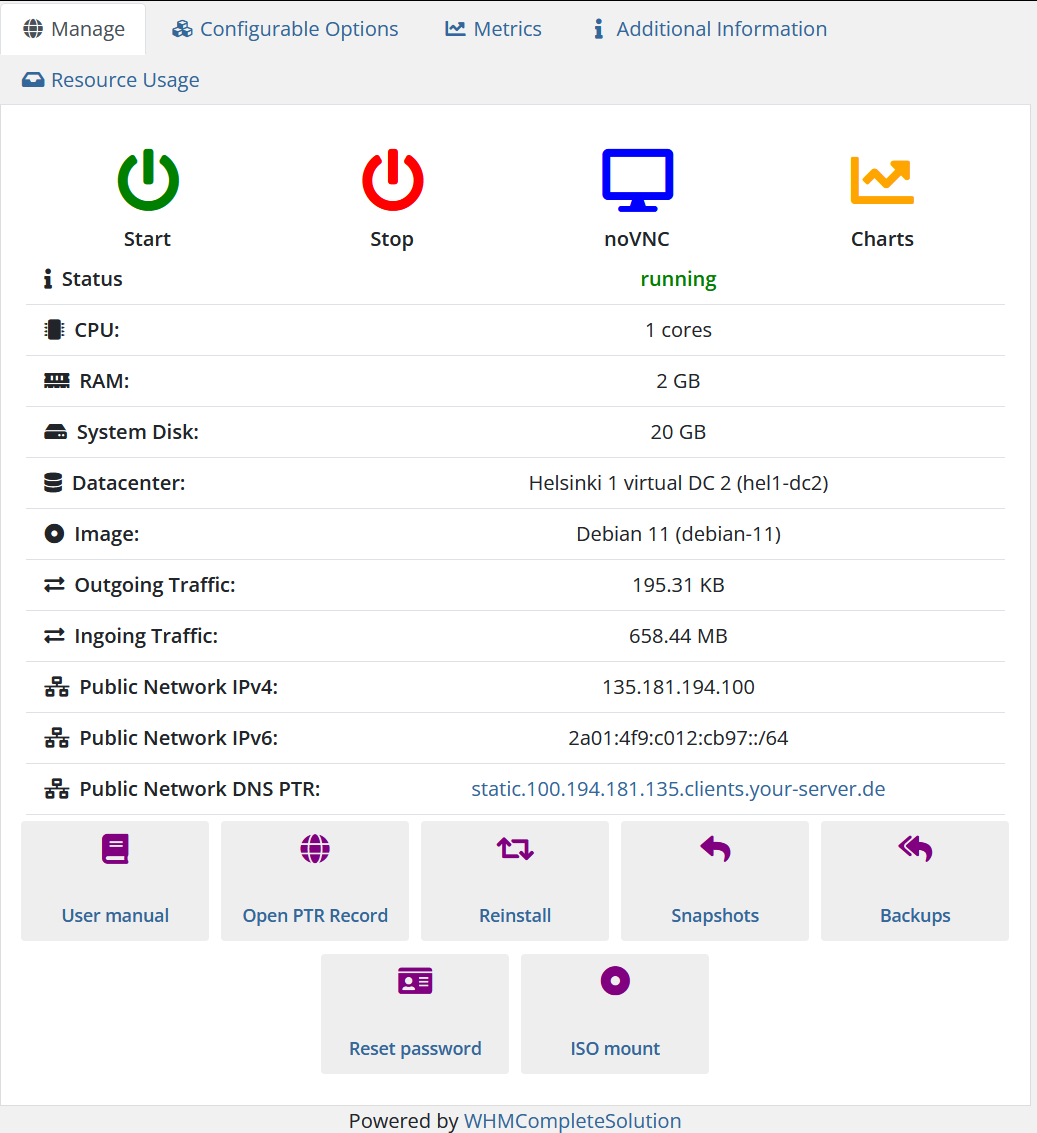
1. The Manage tab

  1. Control Buttons:

    • Start - Green button with a power icon. Starts the server if it was stopped.
    • Stop - Red button with a power icon. Stops the current operation of the server.
    • noVNC - Blue button with a monitor icon. Allows you to open a remote server management window via a web interface (VNC).
    • Charts - Orange button with a graph icon. Allows you to view server performance charts.
  2. Server Status and Information:

    • Status - The current status of the server (in this case, "running" - the server is active).
    • CPU - The number of processor cores allocated to the server (in this case, 1 core).
    • RAM - The amount of RAM allocated to the server (in this case, 2 GB).
    • System Disk - The amount of disk space allocated for the operating system (in this case, 20 GB).
    • Datacenter - The location of the data center where the server is hosted (in this case, Helsinki 1 virtual DC 2).
    • Image - The operating system and its version installed on the server (in this case, Debian 11).
    • Outgoing Traffic - The outgoing traffic used by the server (in this case, 195.31 KB).
    • Ingoing Traffic - The incoming traffic used by the server (in this case, 658.44 MB).
    • Public Network IPv4 - The public IPv4 address assigned to the server.
    • Public Network IPv6 - The public IPv6 address assigned to the server.
    • Public Network DNS PTR - The reverse DNS record for the server's public IP address.
  3. Additional Actions:

    • User manual - Opens the user manual.
    • Open PTR Record - Opens the PTR record for editing.
    • Reinstall - Reinstalls the operating system on the server.
    • Snapshots - Manages snapshots of the server's current state.
    • Backups - Manages the server's backups.
    • Reset password - Resets the password for server access.
    • ISO mount - Mounts an ISO image for installing or restoring the operating system.

image-1725221245271.png

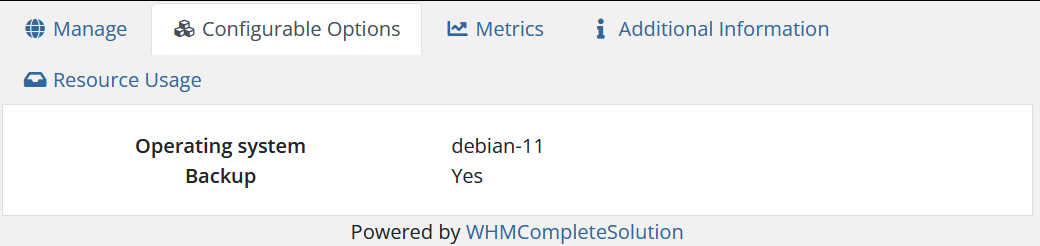
2. Configurable Options tab

  • Here the client will see a list of Configurable Options and their values.
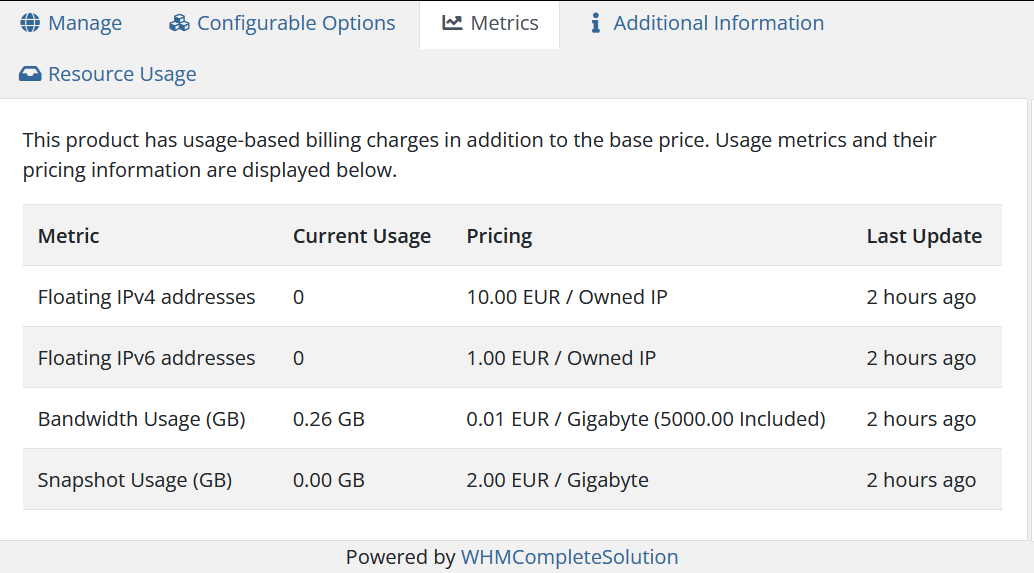
image-1725203831061.png

3. Metrics tab

The "Metrics" tab provides detailed information about usage-based billing for your server in addition to the base price. This section displays various usage metrics, the current usage levels, associated pricing, and the last time the data was updated.

Detailed Breakdown of Metrics:

  1. Floating IPv4 addresses:

    • Current Usage: The number of floating IPv4 addresses currently being used. (In this case, 0)
    • Pricing: The cost associated with each owned floating IPv4 address. (In this case, 10.00 EUR per owned IP)
    • Last Update: The timestamp showing when this data was last refreshed. (In this case, 4 hours ago)
  2. Floating IPv6 addresses:

    • Current Usage: The number of floating IPv6 addresses currently being used. (In this case, 0)
    • Pricing: The cost associated with each owned floating IPv6 address. (In this case, 1.00 EUR per owned IP)
    • Last Update: The timestamp showing when this data was last refreshed. (In this case, 4 hours ago)
  3. Bandwidth Usage (GB):

    • Current Usage: The amount of bandwidth used by the server. (In this case, 0.26 GB)
    • Pricing: The cost per gigabyte of bandwidth used beyond the included allowance. (In this case, 0.01 EUR per GB, with 5000.00 GB included)
    • Last Update: The timestamp showing when this data was last refreshed. (In this case, 4 hours ago)
  4. Snapshot Usage (GB):

    • Current Usage: The amount of storage used for server snapshots. (In this case, 0.00 GB)
    • Pricing: The cost per gigabyte of snapshot storage used. (In this case, 2.00 EUR per GB)
    • Last Update: The timestamp showing when this data was last refreshed. (In this case, 4 hours ago)

image-1725221482708.png

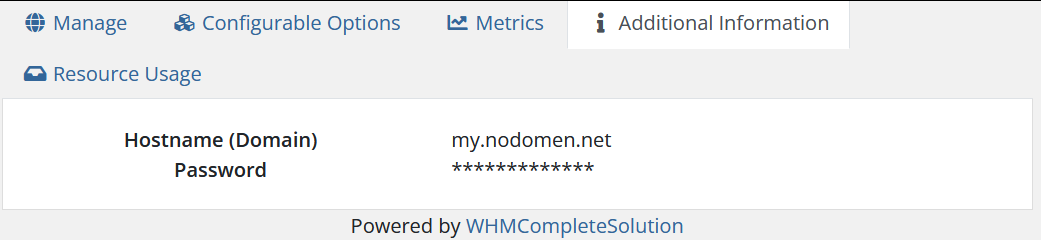
3. Additional Information tab

  • Here the client will see a list of Custom Fields and their values.

image-1725205218236.png

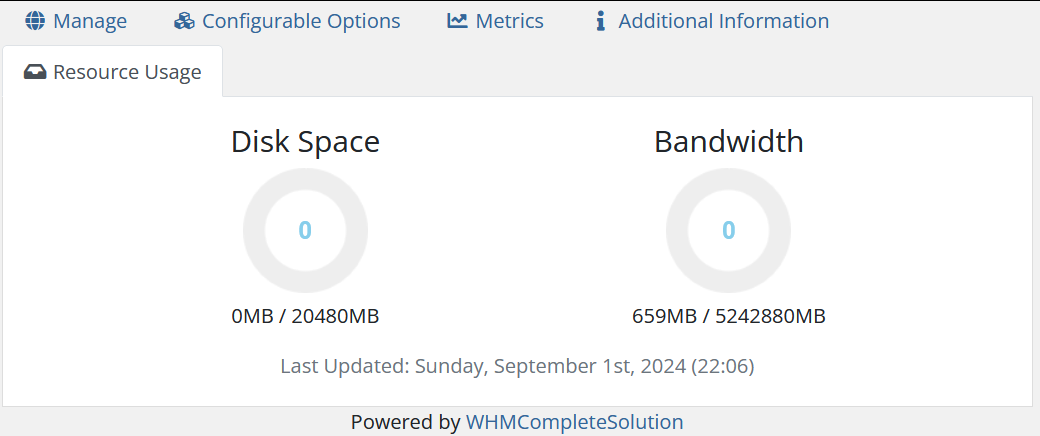
2. The Resource Usage tab

  • Displays service usage statistics

image-1725221299141.png