 Skip to main content
Home screen
PUQVPNCP module WHMCS
Order now | Download | Community | PUQVPNCP | Order PUQVPNCP
The product details page is the Information tab — the module's main client-facing view. Everything on it is loaded dynamically from the PUQVPNCP panel via AJAX the moment the page opens.
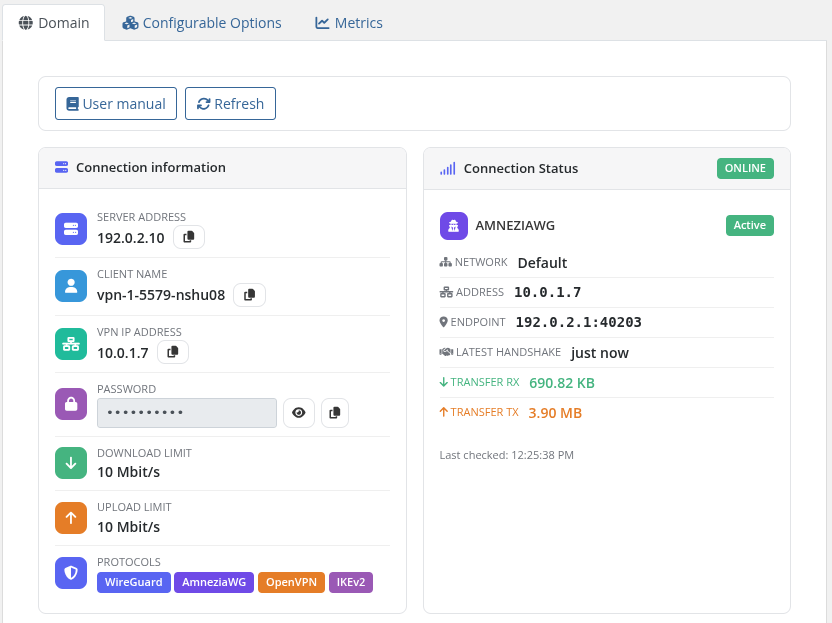 12-home-screen-connection.png
Sidebar
The module replaces the default Information sidebar entry with two of its own:
- Information — the page documented here.
- Traffic statistics — see Traffic statistics.
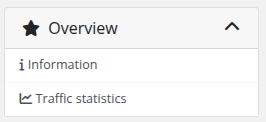 13-home-screen-sidebar.png
User manual
If a Link to instruction is set in the product configuration, a User manual button appears at the top of the page linking to that URL.
Connection status
A live block at the top of the page that polls /api/v1/client/online every 5 seconds (paused while the browser tab is hidden) and shows one card per protocol the client is currently connected on:
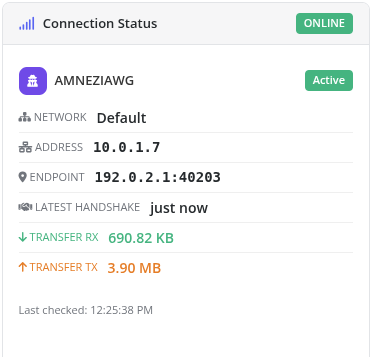 47-home-screen-connection-status.png
- WireGuard — blue accent, shield icon
- AmneziaWG — purple accent, user-secret icon
- OpenVPN — amber accent, globe icon
- IKEv2 — purple accent, key icon
Each card shows: VPN IP, network, endpoint, last handshake (with relative time suffix) and downloaded/uploaded bytes (humanised B/KB/MB/GB). The header pill is Online (green) when at least one protocol reports a session, Offline (red) otherwise.
A manual Refresh button next to the badge forces an immediate fetch.
One-Time Link (OTL)
The fastest way to get a customer connected on a new device: one secure link that carries everything — all protocol configurations, QR codes and credentials — on a page that opens only once.
The Generate One-Time Link button calls POST /api/v1/client/{name}/otl and returns a single-use URL. The card explains the feature up front, and once a link is generated it offers a read-only field with Copy and Open link buttons, plus a clear warning that the link reveals all connection data and stops working the moment it is opened.
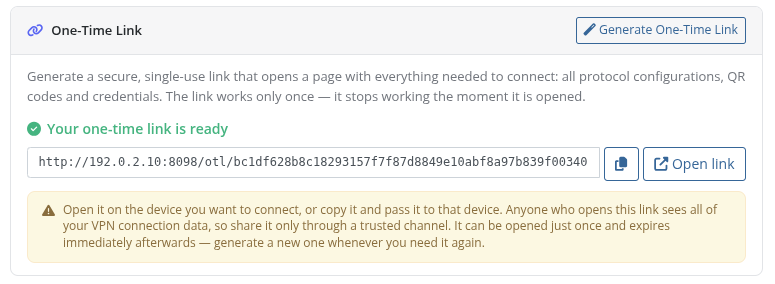 14-home-screen-otl.png
The link is single-use and expires immediately after the first visit — opening it consumes it. Anyone with the link sees the full connection data, so it should be shared only through a trusted channel. Need it again? Just generate a new one. The generate action is POST-only, so an accidental browser prefetch cannot burn the token.
VPN Client
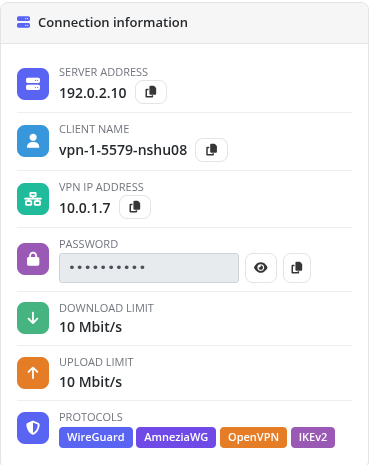
Static card with the panel's authoritative client record:
 15-home-screen-vpn-client.png
- Client name — the identifier on the panel
- VPN IP Address — assigned IPv4
- Username — auth username (used by IKEv2 / OpenVPN)
-
Password — auth password (shown as
<code>) - Download / Upload limit — Mbit/s caps or Unlimited
- Protocols — coloured badges for WireGuard / AmneziaWG / OpenVPN / IKEv2; only protocols actually enabled on the client's network are shown
A status pill in the top-right reads Enabled (green) when the panel reports status:enable, Disabled (red) otherwise.
WireGuard
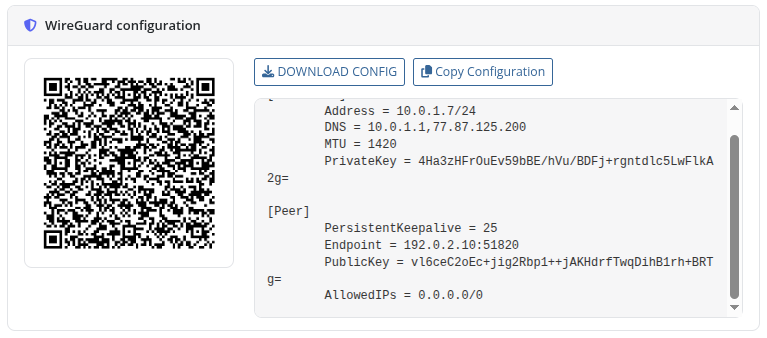
Shown when WireGuard is enabled on the client's network:
 16-home-screen-wireguard.png
-
.conftext in a monospace block with DOWNLOAD CONFIG and Copy Configuration buttons - QR code generated by the panel (click to enlarge in a lightbox; close with the × button or click outside)
AmneziaWG
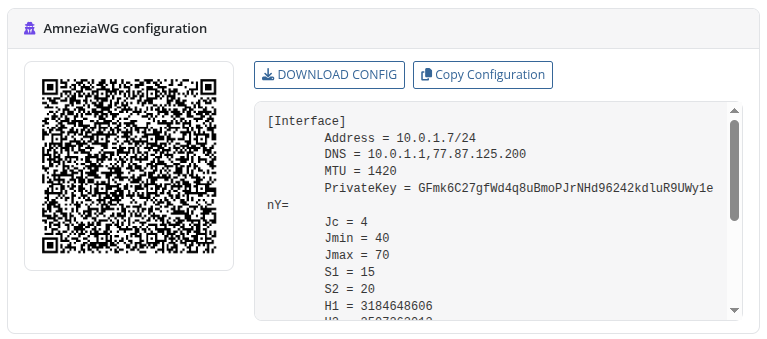
Shown when AmneziaWG is enabled on the client's network:
 46-home-screen-amneziawg.png
- Obfuscated
.confconfiguration text with censorship-resistance parameters (Jc, Jmin, Jmax, S1, S2, H1..H4) in a monospace block with DOWNLOAD CONFIG and Copy Configuration buttons - QR code generated by the panel for instant mobile client scanning (click to enlarge in a lightbox modal)
OpenVPN
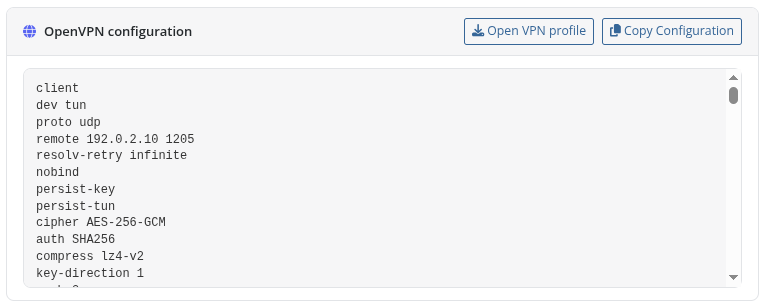
Shown when OpenVPN is enabled on the client's network:
 17-home-screen-openvpn.png
The full .ovpn profile text with Open VPN profile and Copy Configuration buttons.
IKEv2
Shown when IKEv2 is enabled on the client's network:
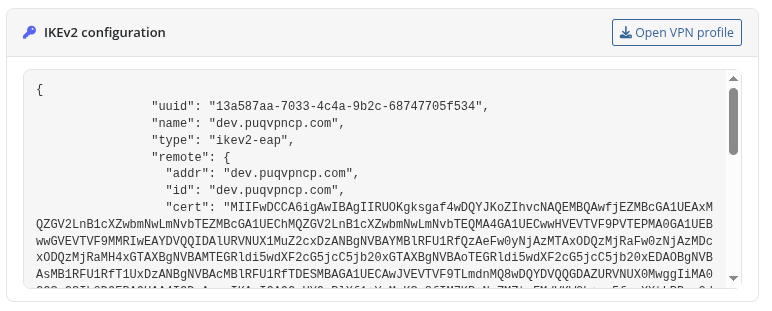 18-home-screen-ikev2.png
The IKEv2 profile (JSON) with an Open VPN profile download button.
Configurable Options tab
When speed presets (Configurable Options) are assigned to the product, clients can review their current bandwidth limits on the dedicated Configurable Options tab:
 44-clientarea-configurable-options.png
Metrics tab
When usage-based metric billing is enabled for the product, clients can track their current monthly traffic consumption and applicable rates on the Metrics tab:
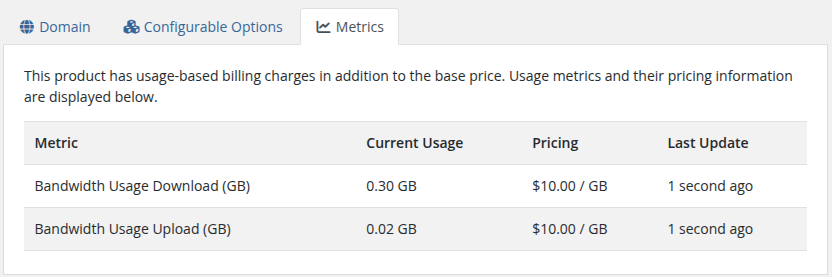 45-clientarea-metrics.png
Traffic statistics
The Traffic statistics entry in the sidebar opens a separate page — see Traffic statistics.