Traffic statistics
PUQVPNCP module WHMCS
Order now | Download | COMMUNITY | PUQVPNCP
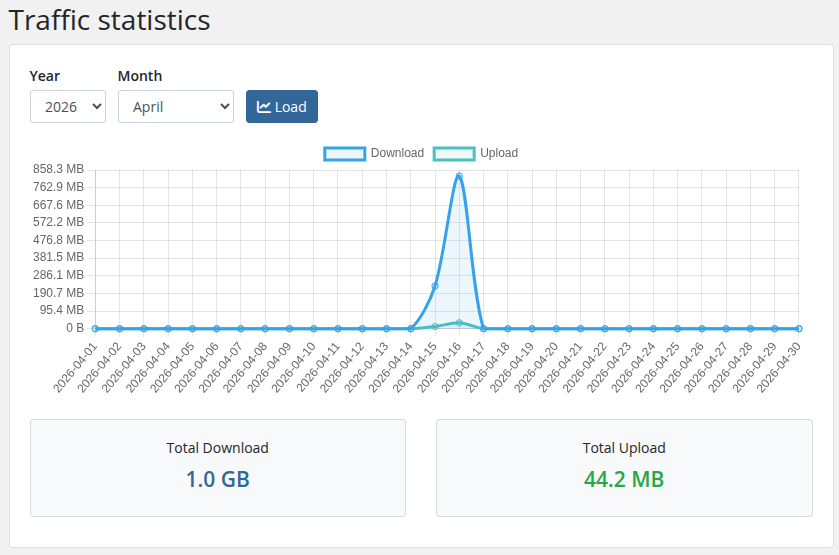
A dedicated page in the client area showing monthly traffic for the VPN client. Entered from the service sidebar via Traffic statistics (action_m=traffic_statistics).
 19-traffic-statistics.png
Controls
- Year / Month selectors — default to the current month. The Year dropdown lists the last four years.
- Load button — refetches data for the chosen period.
Chart
A line chart rendered with Chart.js showing per-day:
- Download (blue line, filled area)
- Upload (green line, filled area)
All values are formatted with a human-readable B / KB / MB / GB / TB scale on hover and on the Y axis.
Totals
Two cards below the chart show the aggregated total download (blue) and total upload (green) for the selected month.
Data source
The page calls GET /api/v1/client/{name}/traffic/{year}/{month} on the PUQVPNCP panel every time Load is pressed. The module does not cache samples — values come live from the panel each render.