Dashboard
Account Statement addon WHMCS
Order now | Download | FAQ
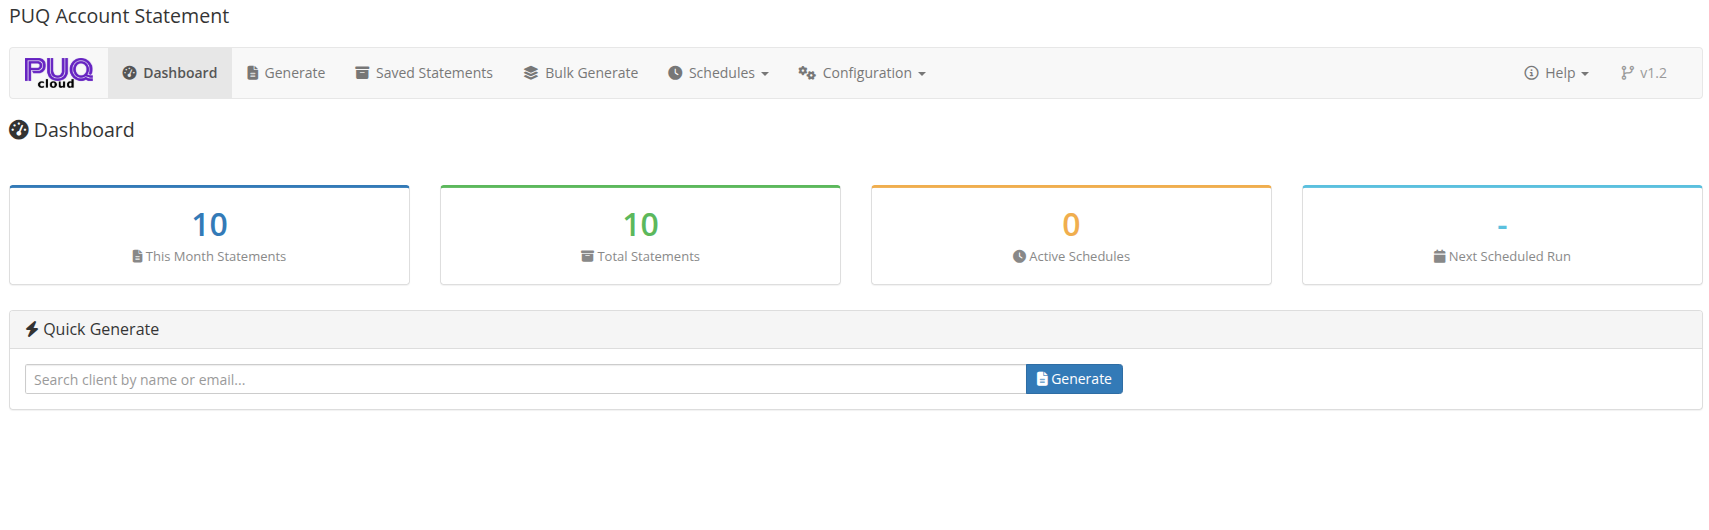
The Dashboard is the home page of the module, available at: Addons > PUQ Account Statement > Dashboard
It provides a complete overview of your statement activity — key metrics, quick generation, recent statements, and upcoming schedules.
 02-dashboard.png
Key Metrics
The top section displays summary cards with color-coded borders:
| Metric | Description |
|---|---|
| This Month Statements | Number of statements generated in the current month |
| Total Statements | Total number of saved statements in the archive |
| Active Schedules | Number of currently active automatic schedules |
| Next Scheduled Run | Date and time of the next scheduled statement generation |
Quick Generate
A search panel for quickly generating a statement for a specific client:
- Start typing a client name or email in the search field
- Select the client from the dropdown results (powered by Select2 with AJAX search)
- Click Generate to navigate to the Generate page with the client pre-selected
Recent Statements
A table showing the 10 most recently generated statements:
| Column | Description |
|---|---|
| Date | When the statement was generated |
| Client | Client full name |
| Period | Statement date range (from — to) |
| Generated By | How the statement was created: manual, schedule, or bulk |
| Actions | View button to open the saved statement |
Upcoming Schedules
A table showing up to 5 active schedules with their next run times:
| Column | Description |
|---|---|
| Name | Schedule name |
| Frequency | How often it runs (Daily, Weekly, Monthly, Quarterly, Yearly) |
| Next Run | Date and time of the next execution |
| Status | Badge: Active (green) or Inactive (gray) |