Monitoring: Task Queue Overview
PUQcloud Panel
Order Now | Download | FAQ
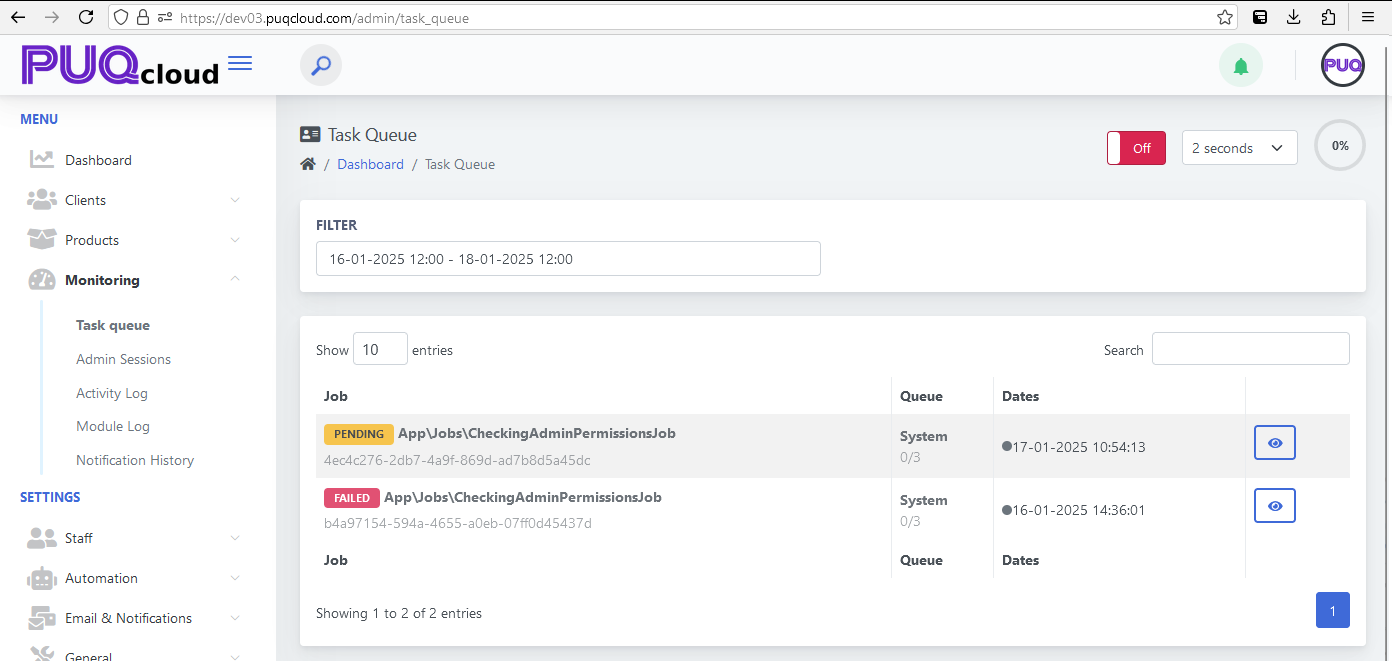
The Task Queue section in the PUQ Cloud Panel is designed to monitor and manage all tasks executed within the system. Each action triggered in the panel, such as background processes, administrative tasks, or scheduled operations, is queued and processed here. This ensures seamless and controlled execution of system jobs while providing administrators with detailed monitoring capabilities.
Key Features:
- Task Overview: Displays a list of all queued tasks, including their current status:
- Pending: Tasks waiting to be executed.
- Processing: Tasks currently being executed.
- Failed: Tasks that encountered an error during execution.
- Completed: Successfully executed tasks.
- Filtering: Administrators can filter tasks based on date ranges, making it easier to find specific jobs within a defined timeframe.
- Job Details: Each task entry includes detailed information:
- Job Name: A clear identifier for the task, such as "App\Jobs\CheckingAdminPermissionsJob."
- ID: A unique identifier for each task, enabling precise tracking.
- Queue: Indicates the queue assigned to the job, along with the number of attempts and retries (e.g., 0/3).
- Timestamp: Shows the exact date and time when the task was queued.
- Action Buttons: Includes options to view detailed information about each job, such as its logs, execution history, or potential errors.
- Real-Time Updates: Administrators can enable live updates to monitor task progress dynamically, with adjustable refresh intervals.
Usage:
This section is essential for maintaining transparency and control over system operations. Administrators can:
- Monitor ongoing tasks and their progress.
- Identify and resolve issues with failed jobs by reviewing error details.
- Ensure that critical background tasks are executed in a timely manner.
Technical Details:
- System Queue Management: The PUQ Cloud Panel leverages a robust queue system to prioritize and execute tasks efficiently. Each queue can handle multiple tasks concurrently, ensuring high system performance.
- Job Retry Mechanism: Failed tasks are retried automatically based on predefined retry policies. The retry count is displayed in the "Queue" column (e.g., 0/3).
- Error Logging: All task errors are logged for review. Administrators can access detailed error messages to diagnose and fix issues.
Screenshot Reference:
The interface provides a clean layout with filters, job statuses, and detailed task information, as shown in the attached screenshot:
- Filter: A date range selector allows narrowing down tasks to a specific period.
- Status Labels: Color-coded labels (e.g., yellow for "Pending" and red for "Failed") make it easy to identify the task's status.
- Action Icons: The eye icon enables administrators to view detailed logs and job execution specifics.


No Comments