Check and manage Activity Log
PUQcloud Panel
Order Now | Download | FAQ
Overview
The Activity Log section in PUQcloud Panel provides a centralized record of all important system and user actions.
Every event — whether triggered by an administrator, client, or automated background job — is logged here to ensure full transparency and accountability.
Activity tracking runs entirely in the background, meaning multiple operations can be recorded simultaneously without affecting system performance.
This allows administrators to trace actions, monitor transactions, and quickly investigate unusual activity.
Navigation Path
Dashboard → Monitoring → Activity Log
Key Features
| Feature | Description |
|---|---|
| Full Action History | Tracks all actions performed by users and system processes. |
| Performance-Safe Logging | Background operation ensures stable performance during heavy load. |
| Detailed Event Data | Each record includes time, initiator, action type, and description. |
| Filter by Date Range | Focus on specific periods to analyze system behavior. |
| Search Function | Quickly find specific actions or users. |
| Auto Refresh Option | Keep the log updated in real time for live monitoring. |
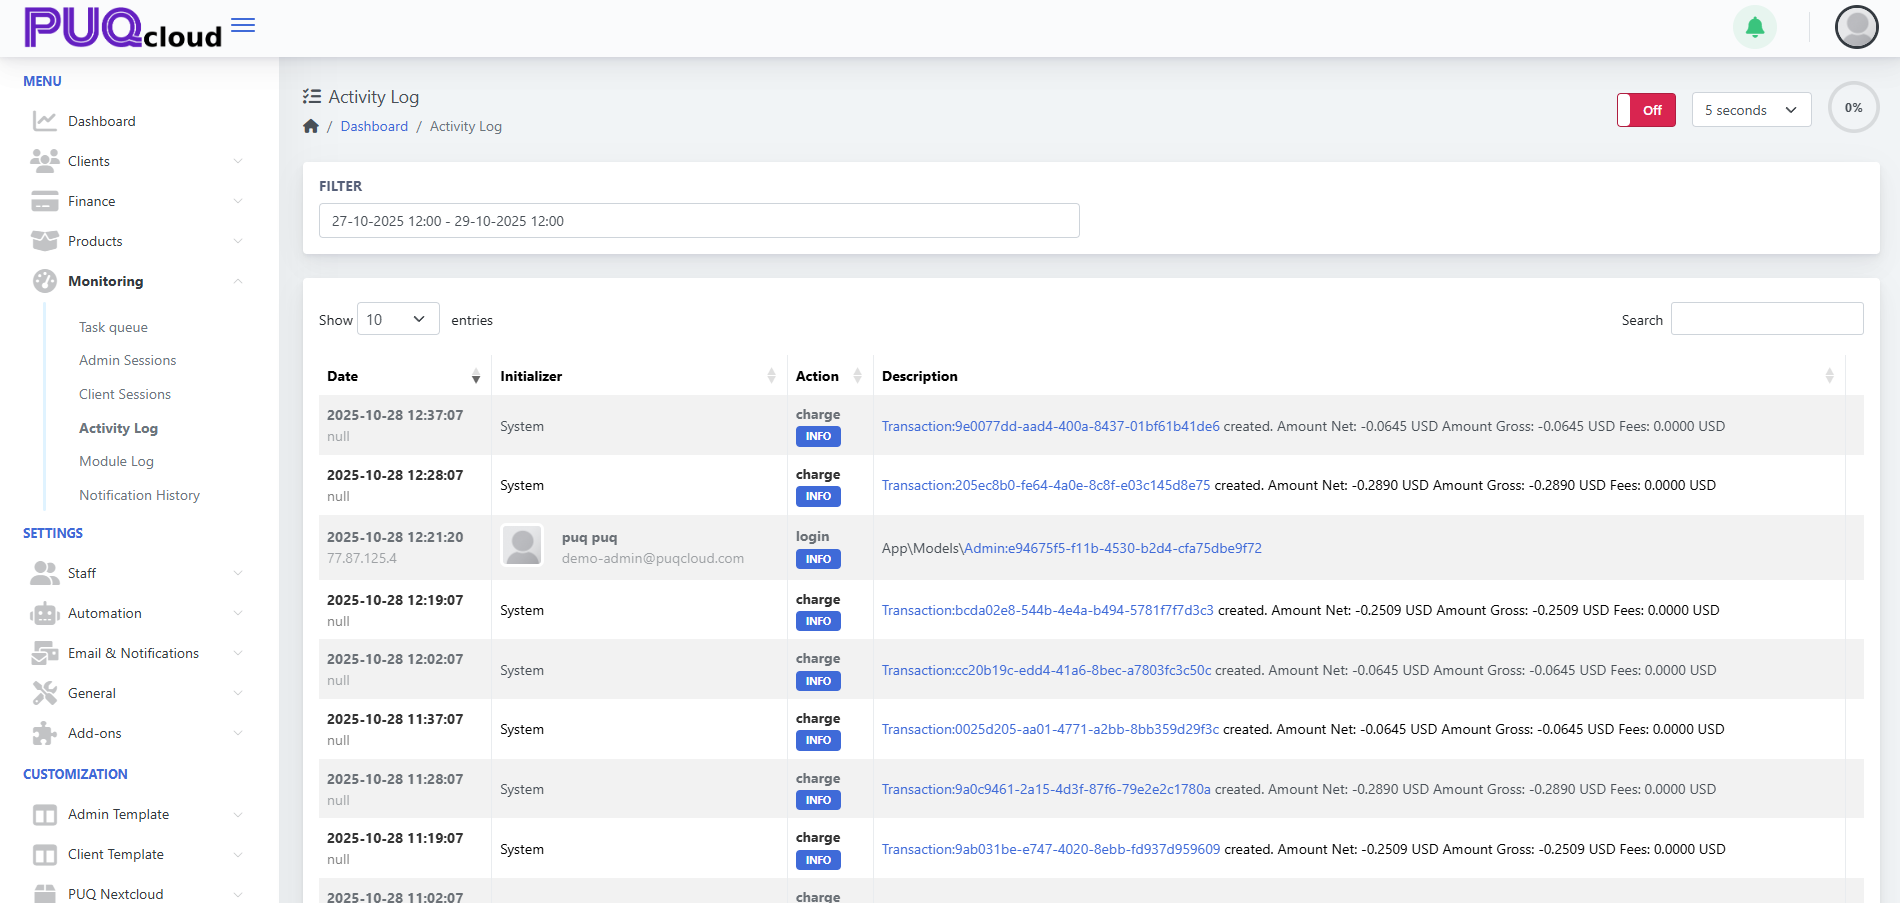
Using the Activity Log
1. Access the Activity Log
You’ll see a structured table displaying all recent system activities with columns for:
-
Date
-
Initializer (User or System)
-
Action
-
Description
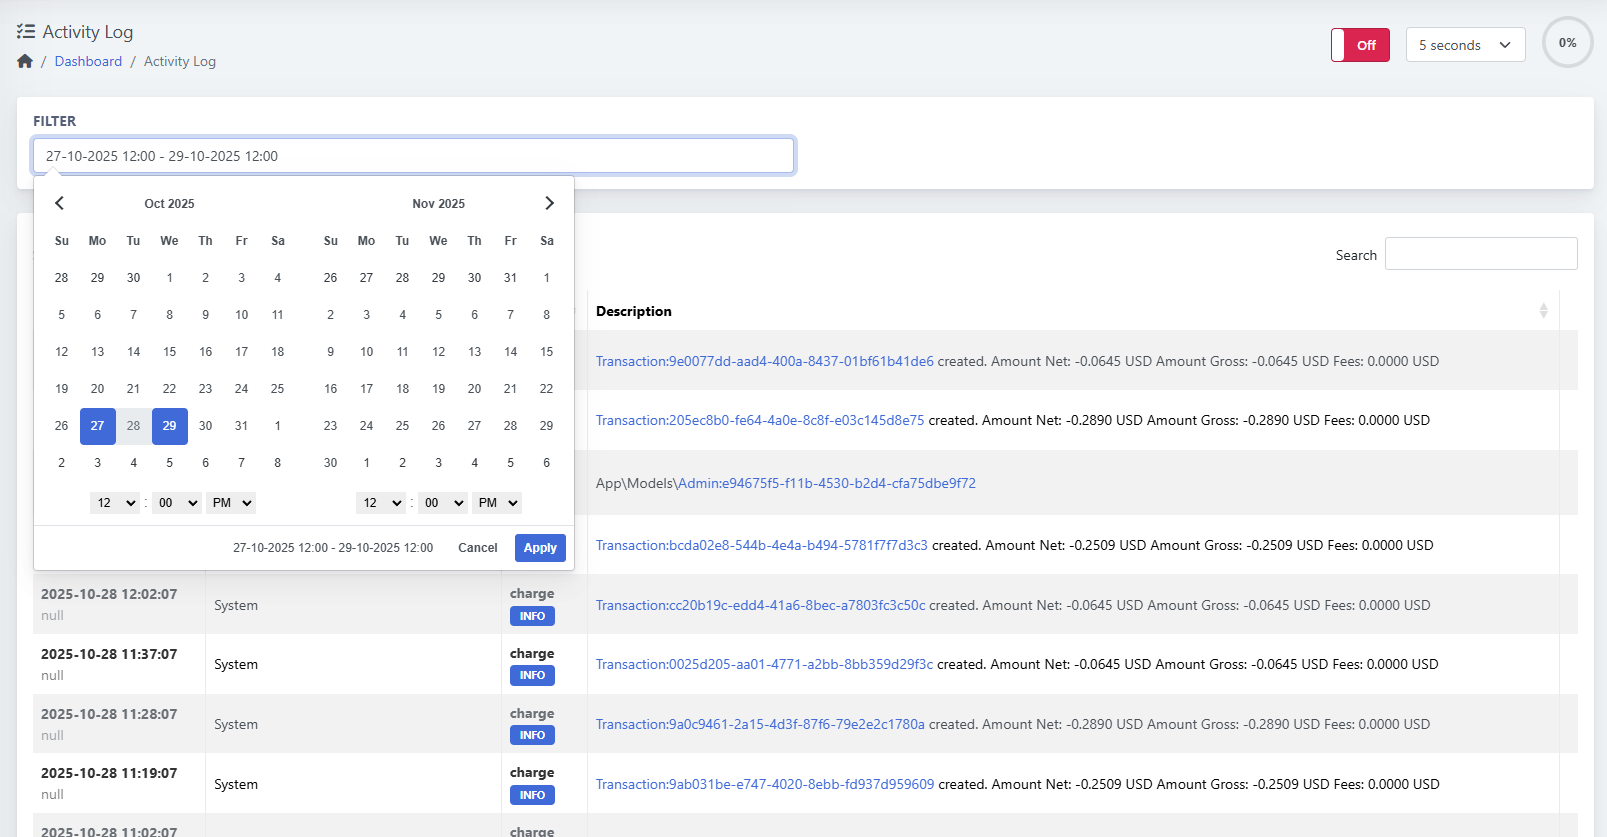
2. Filter by Date and Time
To focus on a specific time range, use the Filter field.
Click the input box to open the date/time selector, choose your preferred period, and click Apply.
Columns Explained
| Column | Description |
|---|---|
| Date | Timestamp of when the action occurred. |
| Initializer | The actor who performed the action (e.g., system, admin, or client). |
| Action | The operation type (e.g., charge, login, create, update). |
| Description | Detailed log entry including affected model, transaction link, and related data. |
Action Types
| Label | Meaning |
|---|---|
| 🟦 INFO | Informational log (e.g., successful login, transaction created). |
| 🟧 WARNING | Indicates potential issue or unusual operation. |
| 🔴 ERROR | Operation failed or triggered an exception. |
Queue Controls
| Control | Description |
|---|---|
| Auto Refresh Interval | Located at the top right. Define how often logs refresh (e.g., every 5 seconds). |
| Off/On Switch | Enables or disables automatic refresh. |
| Search Box | Find actions by keyword, ID, or user. |
Example Use Case
An administrator wants to verify all automated billing actions executed by the system.
By filtering the Activity Log, they can view entries such as:
2025-10-28 12:37:07 | System | charge | Transaction:9e0077dd-aad4-400a-8437-01bf61b41de6 created.
Amount Net: -0.0645 USD Amount Gross: -0.0645 USD Fees: 0.0000 USD
This helps confirm that automated transactions ran correctly and without errors.
Tips
-
Use Activity Log as your primary audit trail for all background and user operations.
-
Combine it with Admin Sessions and Client Sessions for full transparency.
-
Use search filters to isolate suspicious events quickly.
-
Since logging runs asynchronously, you can safely enable real-time refresh during monitoring.