Check and manage Admin Sessions
PUQcloud Panel
Order Now | Download | FAQ
Overview
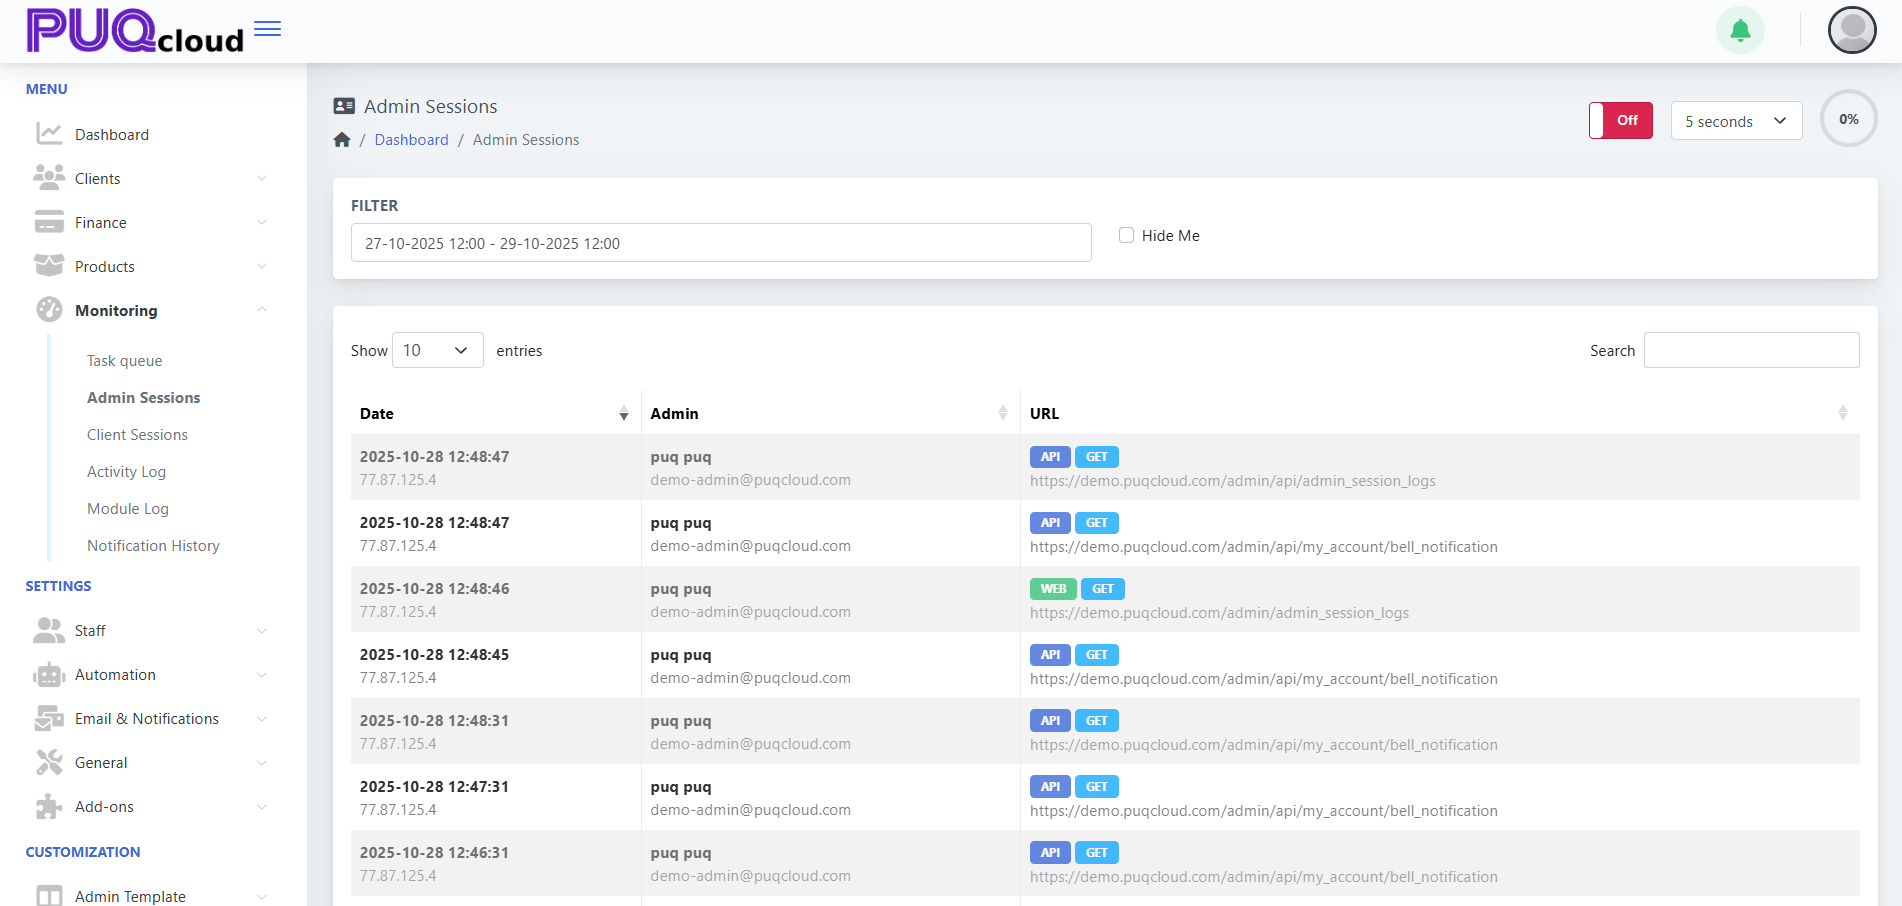
The Admin Sessions section in PUQcloud Panel allows system administrators to monitor all admin activities and requests executed through both web and API interfaces.
Each session is logged automatically, showing the admin user, IP address, accessed URL, and method type.
This monitoring tool helps maintain transparency, detect unusual activity, and ensure security compliance within your PUQcloud environment.
Just like the Task Queue, these operations run in the background, ensuring no performance impact on the system while recording all admin actions.
Navigation Path
Dashboard → Monitoring → Admin Sessions
Key Features
| Feature | Description |
|---|---|
| Complete Admin Logs | Tracks all admin operations across the web panel and API requests. |
| Background Tracking | Logs are recorded automatically without slowing down system performance. |
| Filter by Date Range | Focus on specific time periods for auditing or troubleshooting. |
| Auto Refresh Control | Choose how often session logs update automatically. |
| Search and Sorting | Quickly find specific admins, URLs, or IP addresses. |
| “Hide Me” Option | Exclude your own sessions from the view for cleaner analysis. |
Using the Admin Sessions Page
1. Access the Page
Go to
Dashboard → Monitoring → Admin Sessions
You will see a list of session entries, each containing:
-
Date and Time
-
Admin Name and Email
-
IP Address
-
Request Type (WEB/API, GET/POST)
-
Accessed URL
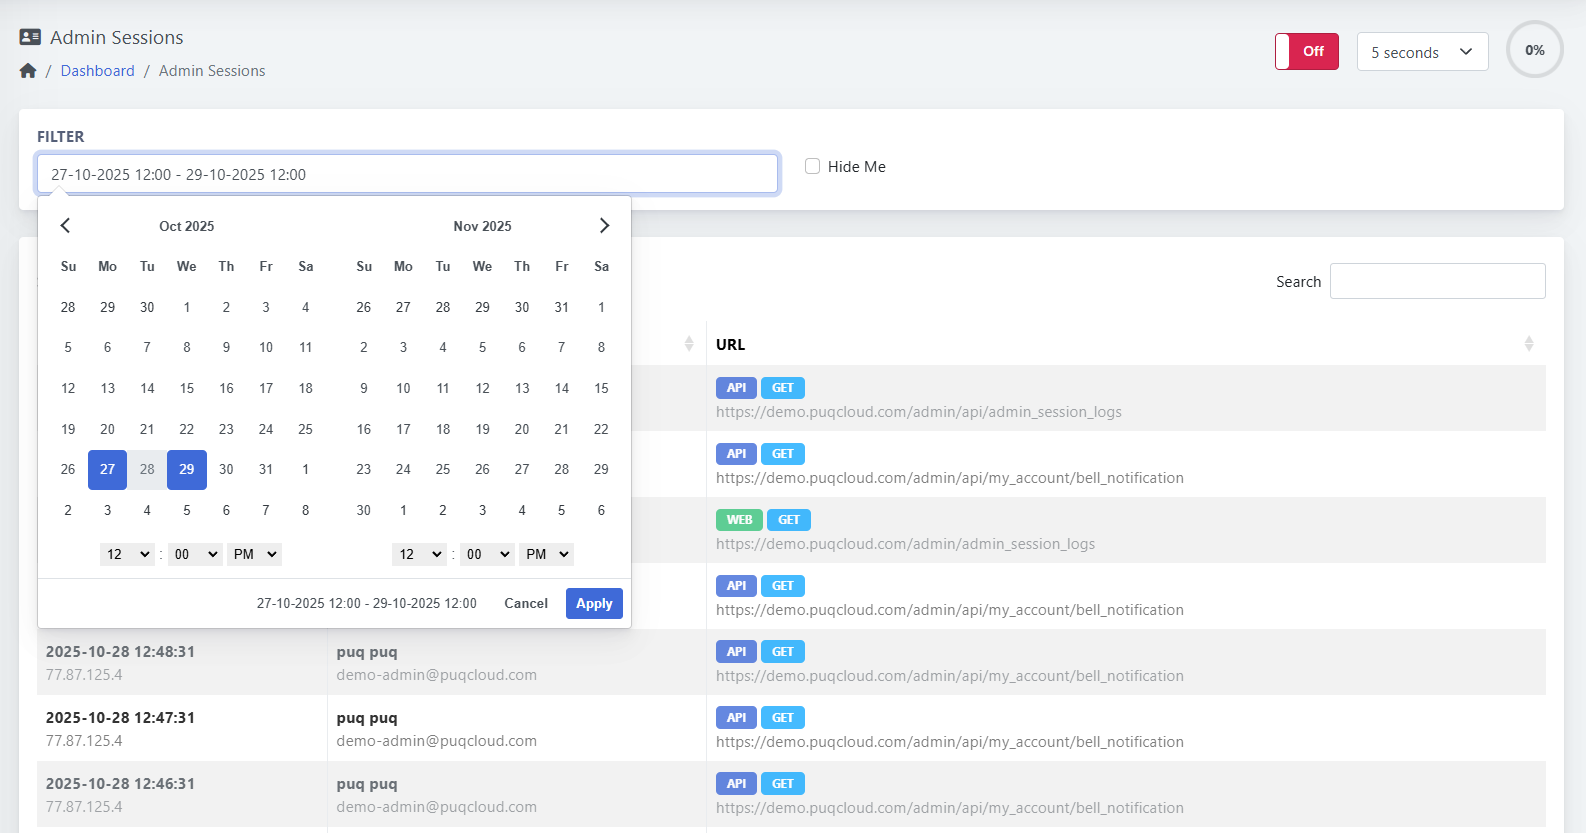
2. Filtering Sessions
Use the Filter field to select a time range.
Click inside the date field to open the calendar, choose a start and end date, and confirm with Apply.
This helps narrow the view to a specific investigation period.
Columns Explained
| Column | Description |
|---|---|
| Date | Timestamp of when the admin made a request. |
| Admin | Name and email of the administrator. |
| IP Address | Logged IP address from which the request was made. |
| URL | Full path of the accessed page or API endpoint. |
| Type (WEB/API) | Indicates the source of the request. |
| Method (GET/POST) | Shows the HTTP method used. |
Status Labels
| Label | Meaning |
|---|---|
| 🟦 API | Request came through the system API. |
| 🟩 WEB | Request made through the web interface. |
| 🟢 GET | Data was fetched from the system. |
| 🟠 POST | Data was sent or modified. |
Queue Controls
| Control | Description |
|---|---|
| Auto Refresh Interval | Located in the top right. You can set refresh time (e.g., every 5 seconds). |
| Off/On Switch | Enables or disables automatic refreshing. |
| Search Box | Filter results by keyword (admin name, URL, IP). |
Example Use Case
An administrator wants to verify recent API requests:
By opening Monitoring → Admin Sessions, they can view every endpoint accessed, including timestamps, IP addresses, and request types.
Example entry:
2025-10-28 12:48:47 | puq puq | demo-admin@puqcloud.com
API GET → https://demo.puqcloud.com/admin/api/admin_session_logs
IP: 77.87.125.4
Tips
-
Enable short auto-refresh intervals (2–5 seconds) for real-time monitoring.
-
Use the Hide Me checkbox to exclude your own requests while observing other admins.
-
Combine date filtering with keyword search for precise audits.
-
API and web sessions are logged in one unified view for maximum traceability.