Check and manage Module Log
PUQcloud Panel
Order Now | Download | FAQ
Overview
The Module Log in PUQcloud Panel provides detailed records of all operations executed by modules — including API requests, SSH commands, and service actions.
It helps administrators debug, monitor, and audit communication between PUQcloud and external systems such as Proxmox, Nextcloud, and others.
All logging processes run in the background, allowing multiple modules to record events simultaneously without impacting performance.
This ensures that even heavy automation tasks remain fast and efficient.
Navigation Path
Dashboard → Monitoring → Module Log
Key Features
| Feature | Description |
|---|---|
| Detailed Module-Level Tracking | Records every request and response for each module. |
| Safe Background Execution | All logs are generated asynchronously to avoid slowing down the system. |
| Live Monitoring | Real-time updates every few seconds for active debugging. |
| Filter by Date and Time | Review specific activity ranges. |
| Search and Filter | Quickly locate logs by module name, action, or keyword. |
| Log Viewer | Inspect full request and response content for debugging. |
| Delete All Logs | Instantly clear old logs when troubleshooting is complete. |
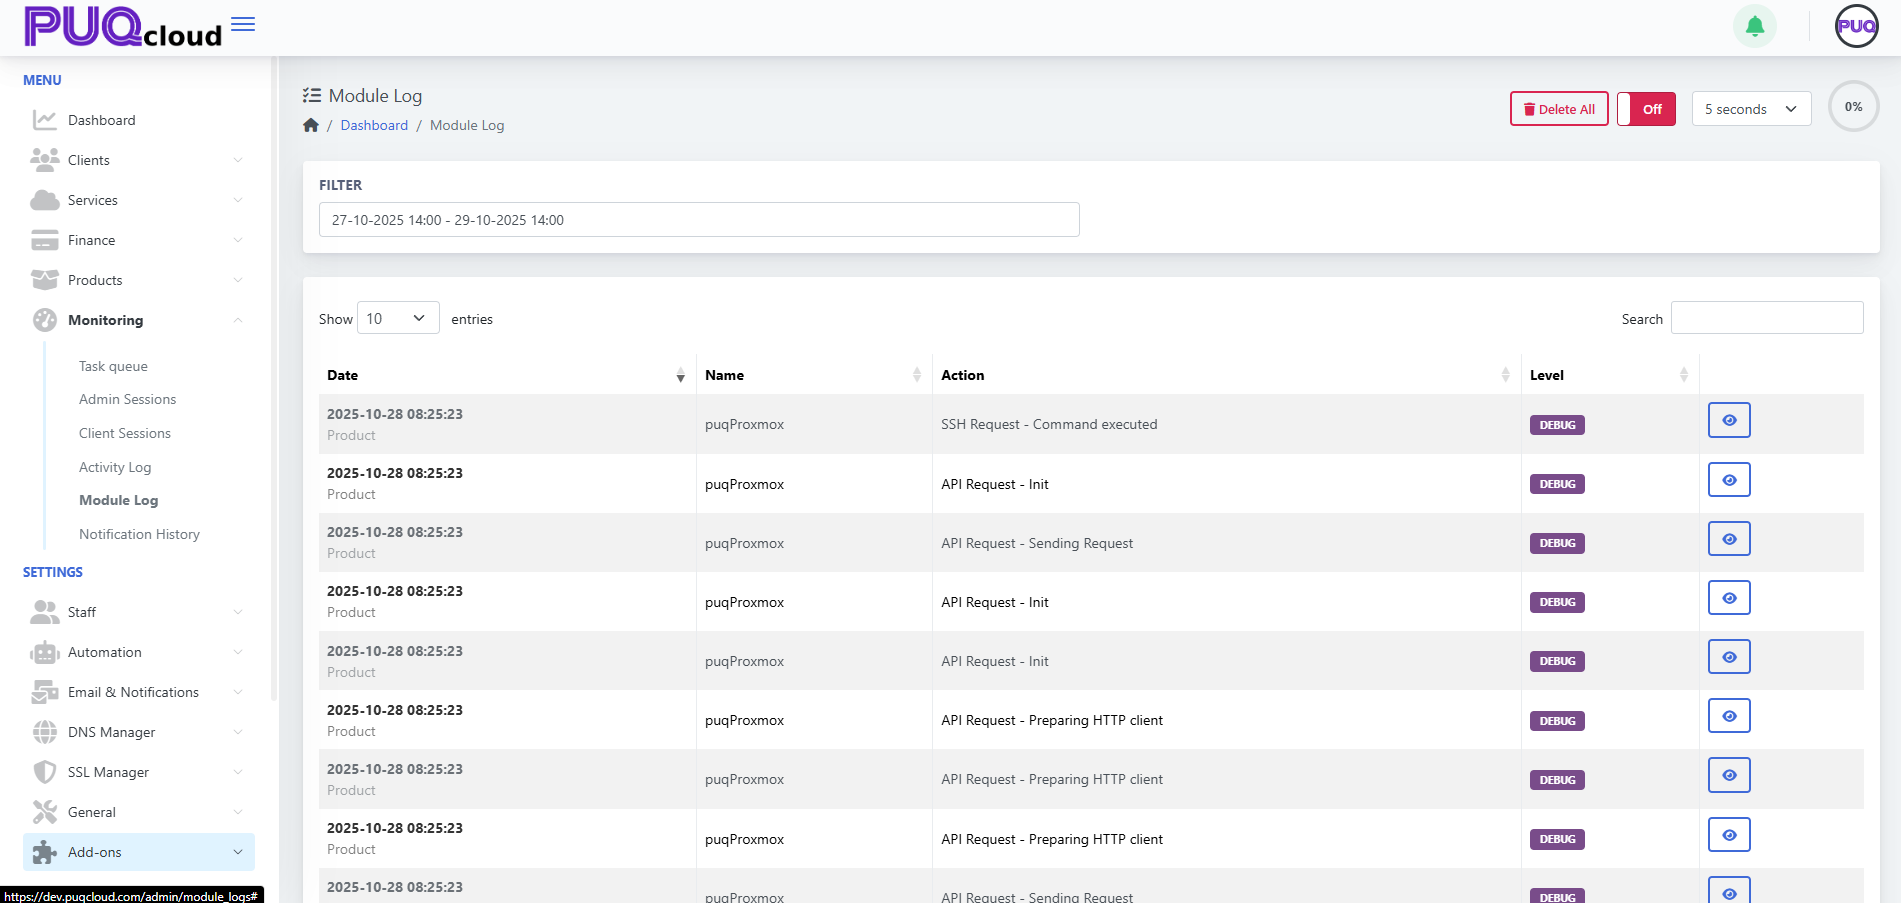
Using the Module Log
1. Access the Page
You’ll see all module-related activity displayed in a structured table with columns for:
-
Date
-
Name (module name)
-
Action
-
Level
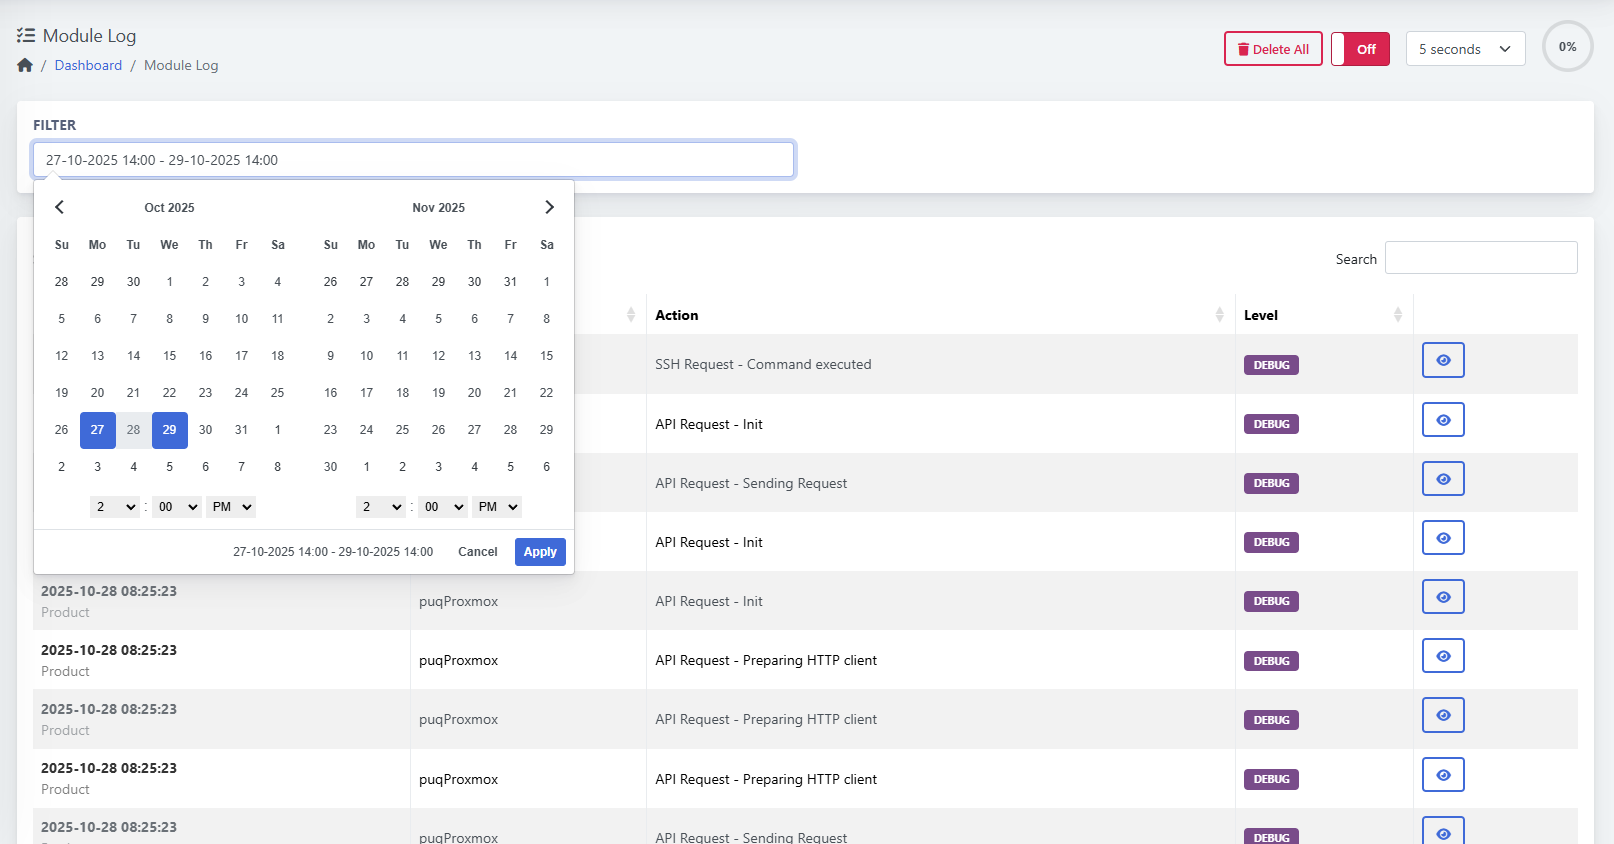
2. Filter by Date and Time
To focus on a specific period, use the Filter control at the top.
Select the desired start and end dates and times, then click Apply to reload the results.
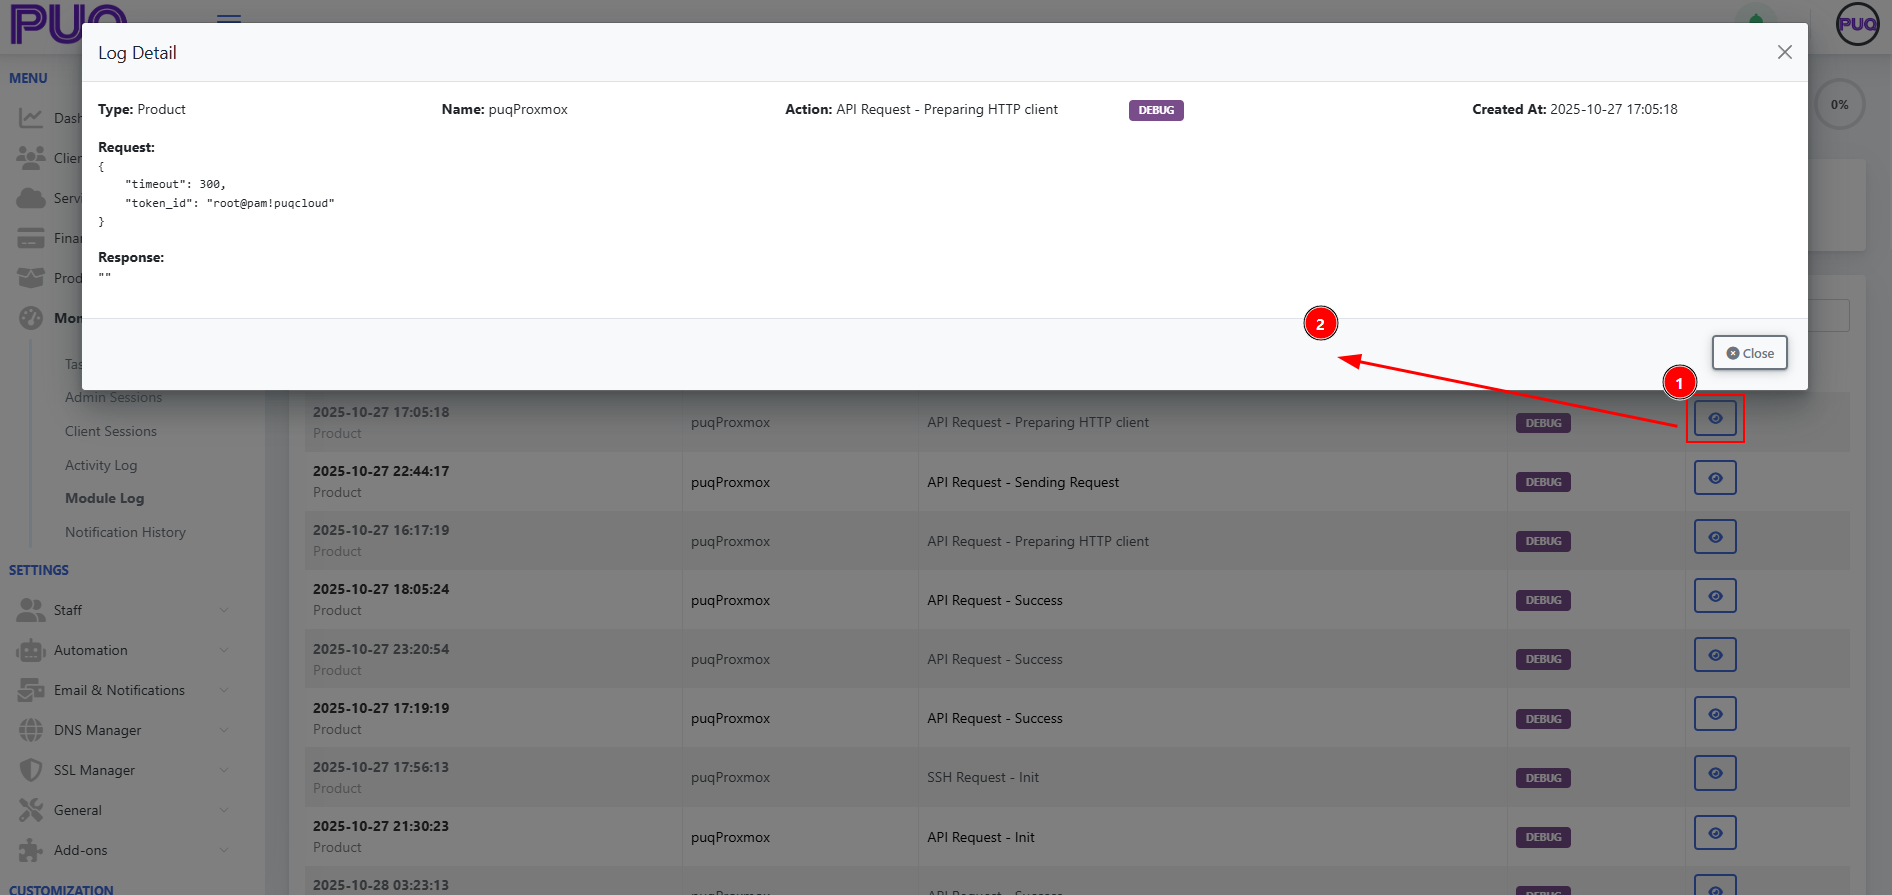
3. View Log Details
Each record includes a “View” (👁️) icon on the right.
Click it to open the detailed log window showing:
-
Type and Module Name
-
Action Type
-
Log Level
-
Request Payload
-
Response Data
This view is essential for debugging API and SSH communication.
Columns Explained
| Column | Description |
|---|---|
| Date | Timestamp of the log entry. |
| Name | The name of the module (e.g., puqProxmox, puqNextcloud). |
| Action | Describes what operation was executed (API Request, SSH Command, etc.). |
| Level | Indicates the log type (Debug, Info, Warning, Error). |
Log Levels
| Level | Description |
|---|---|
| 🟣 DEBUG | Detailed technical data for developers and administrators. |
| 🟦 INFO | Informational events indicating normal operation. |
| 🟧 WARNING | Non-critical issue or irregular response. |
| 🔴 ERROR | Operation failed or received invalid data. |
Controls and Options
| Control | Description |
|---|---|
| Auto Refresh | Refresh interval (top-right) allows you to monitor logs in real time. |
| Off/On Switch | Enable or disable live updates. |
| Search Box | Quickly find logs by action or module name. |
| Delete All | Clears all logs at once — useful after debugging sessions. |
Example Use Case
While testing the puqProxmox module, the administrator can open Module Log to check the API and SSH calls executed during a provisioning process.
Example entry:
2025-10-28 08:25:23 | puqProxmox | API Request - Sending Request | DEBUG
By clicking the 👁️ icon, the admin can inspect both the request JSON and the response received from the external system.
Tips
-
Use DEBUG level logs for troubleshooting module integrations.
-
Regularly clear old logs to keep your workspace clean.
-
Combine with the Task Queue section to trace background automation steps.
-
Since logs are recorded asynchronously, there’s no performance degradation, even during heavy module execution.