History
PUQ Customization module WHMCS
Order now | Download | FAQ
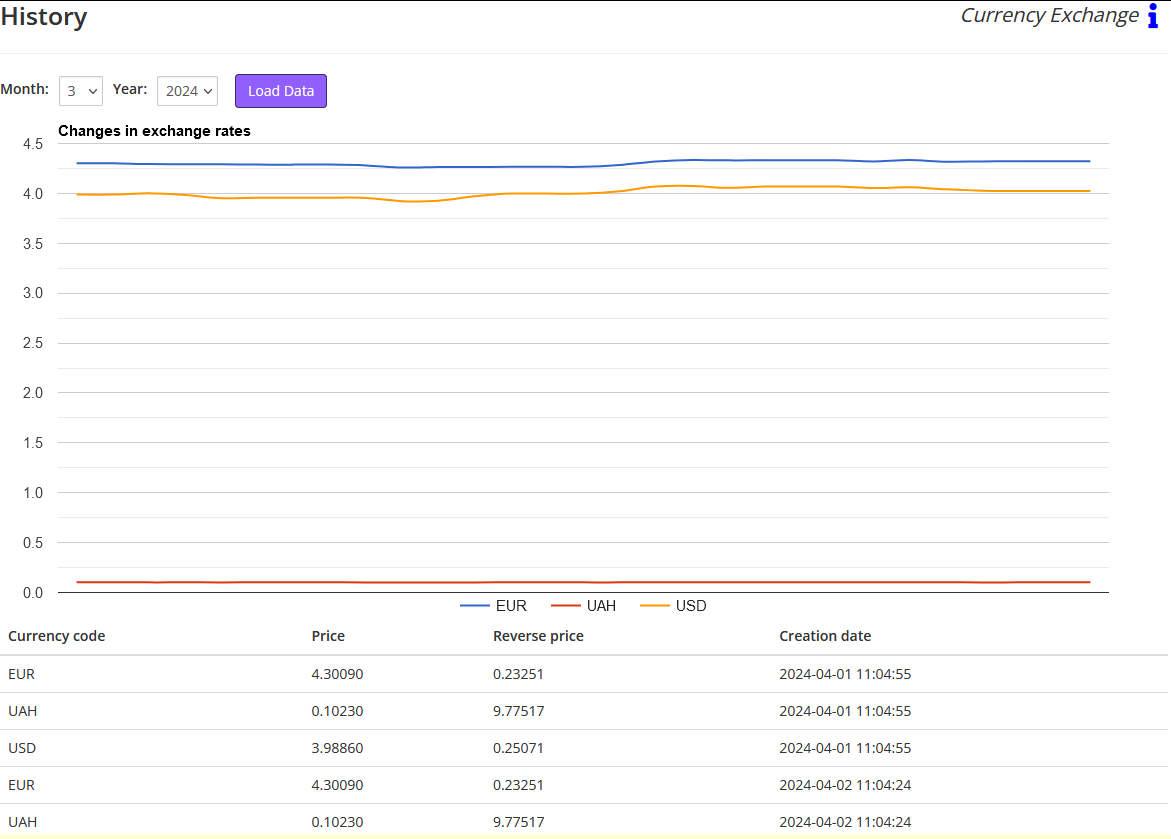
The "History" page within the Currency Exchange extension is a comprehensive tool that allows users to view and analyze the historical data of currency exchange rates. Here’s a detailed breakdown of the components on this page:
- Date Selection: At the top of the page, there are dropdown menus for "Month" and "Year," allowing users to select a specific period for which they want to view exchange rate history. Once the desired month and year are selected, clicking the "Load Data" button will fetch the exchange rates for that period.
- Graph of Changes in Exchange Rates: This is a line chart that visually represents the fluctuations in exchange rates over the selected period. Each currency has its own line with a distinct color, making it easy to track and compare their performance over time.
- Detailed Rate Table: Below the graph, there's a table displaying detailed information about the exchange rates. The columns include:
- Currency Code: Shows the three-letter code for each currency.
- Price: The exchange rate of the currency against a base currency (not explicitly mentioned, likely to be the system’s default or primary currency).
- Reverse Price: This column shows the inverse of the exchange rate, which could be useful for transactions where the inverse rate is more relevant.
- Creation Date: Indicates the exact date and time when the rate was recorded or updated in the system.
- Data Presentation: The table updates to reflect the data for the month and year selected through the dropdown menus at the top of the page. Each entry corresponds to a specific point in time, showing how exchange rates have been captured and stored systematically.
This "History" page is crucial for financial analysis and decision-making, providing a clear historical perspective on currency performance that can help in forecasting and financial planning. The integration of both graphical and tabular data presentation ensures that users can both visually appreciate trends and access precise numerical values for deeper analysis.